9 End of Semester Tips for Grading Using Blackboard
End of Semester Grading Tips
As we near the end of the semester and the time to submit final grades, we wanted to share a few helpful tips.
Tip 1: Use the Faculty Center ‘Grade Upload’ feature to submit final grades to the registrar
Navigate to ‘Grade Roster’ in Faculty Center and select the ‘Grade Upload’ feature to submit final grades. This feature allows you to import multiple grades to a grade roster from a spreadsheet (.CSV file). Grade Upload can now be used to import grades from combined classes (cross lists and co-meets) as well as stand-alone classes. Click here for Step-by-step Instructions
For Assistance uploading grades to Faculty Center, Call the Office of the University Registrar at 607-254-4795; hours are Mon-Fri 8:00 AM-4:15 PM.
Tip 2: How to Download and Upload Grades From Blackboard Grade Center
You can download all or part of the Grade Center and open it in a spreadsheet. This option allows you to enter or edit grades offline. New data can then be uploaded back into the Blackboard Grade Center. The following tutorial will show you how to set download options, download the grade center file, upload the new file, and select which grades to change. Video Tutorial: Working Offline with Grade Center
When viewing the following tutorial please note that Cornell’s custom menu option is named ‘Download/Upload’.
Tip 3: Use Blackboard’s Grade Center to Calculate Final Grades
In the Grade Center, you can calculate grades by combining multiple columns to attain performance results, such as class averages, final grades that are based on a weighted scale, or total points. These are called calculated columns. You can display these columns to students so they can view performance results, or you can make them visible only to course faculty and TAs.
There are four different types of calculated columns:
- Total: A calculated column that generates a grade based on the cumulative points earned, related to the points allowed
- Weighted: A calculated column that generates a grade based on the result of selected columns and categories, and their respective percentages
- Average: A calculated column that displays the average for a selected number of columns.
- Minimum/Maximum: A calculated column that displays either the minimum or maximum grade for a selection of columns
Tip 4: Creating a Total Column in Grade Center
The total column is a type of calculated column that generates a grade based on the cumulative points earned, related to the points allowed. When creating a total column you can select which columns (including other calculated columns) and categories to include in the total column calculation.
A total column is created by default and appears automatically when the course is created.
The following list includes the default settings for a Total Column:
- All grade columns are included in the calculation. You can change this by editing the column and selecting not to include a given column in Grade Center Calculations.
- Calculated columns are not included. You can change this when you set up your Total column.
- Ungraded items are not included. You can change this by editing the column and selecting No for Calculate as Running Total.
Tip 5: Running Total and Running Weighted Total Columns in Blackboard Grade Center
This Grade Center option allows total columns to be rendered as ‘Running Totals’ or ‘Running Weighted Totals’. Running totals give students information regarding the status of their grades in progress during the semester. At the end of the semester, however, it is recommended that you turn off the running total option, or enter a zero for any past assignment that a student has not completed.
Tip 6: Option to Exempt Individual Grades From Final Grade Calculations
You have the option to exempt students from any grade item in the Grade Center. For example, you may elect to exempt certain grades for students that added the course late or require other accommodations due to special circumstances.
To exempt a grade for a given assignment:
- Go to Grade Center
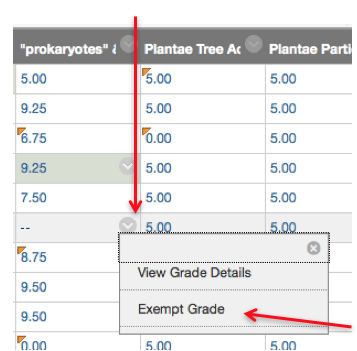
- Select the chevron next to the grade item you want to exempt for a given individual
Select ‘Exempt Grade’
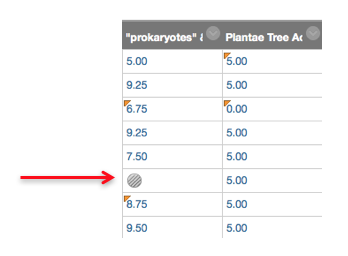
3. A grey scale circle will appear in the box for the Exempt Grade. Exempt grades are ignored in all total and statistical calculations.
Tip 7: Creating a Weighted Column in Grade Center
A weighted column generates a grade based on the result of selected columns and categories, and their respective percentages. When creating a weighted column, you can include other calculated columns or other weighted columns. Weighting grades by category gives you the option of dropping the lowest grade in the category; if you weight by item, you do not have this option.
Steps for calculating weighted grades:
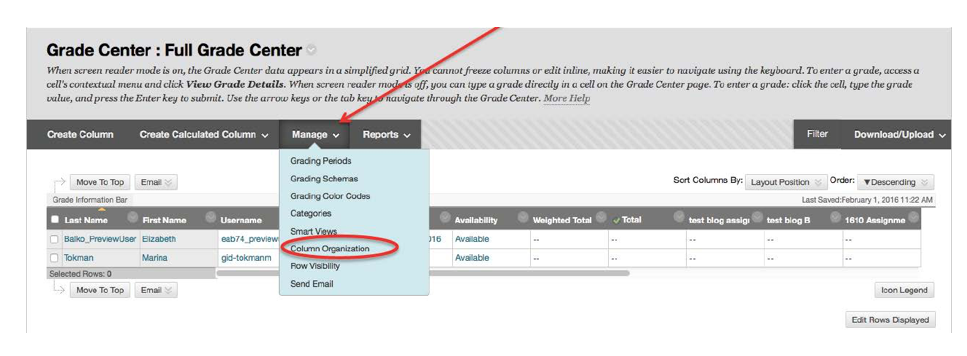
- Assign the appropriate ‘Category’ to each column of grades you want included in the final weighted grade calculation. You can assign columns to categories in the Manage > Column Organization view.
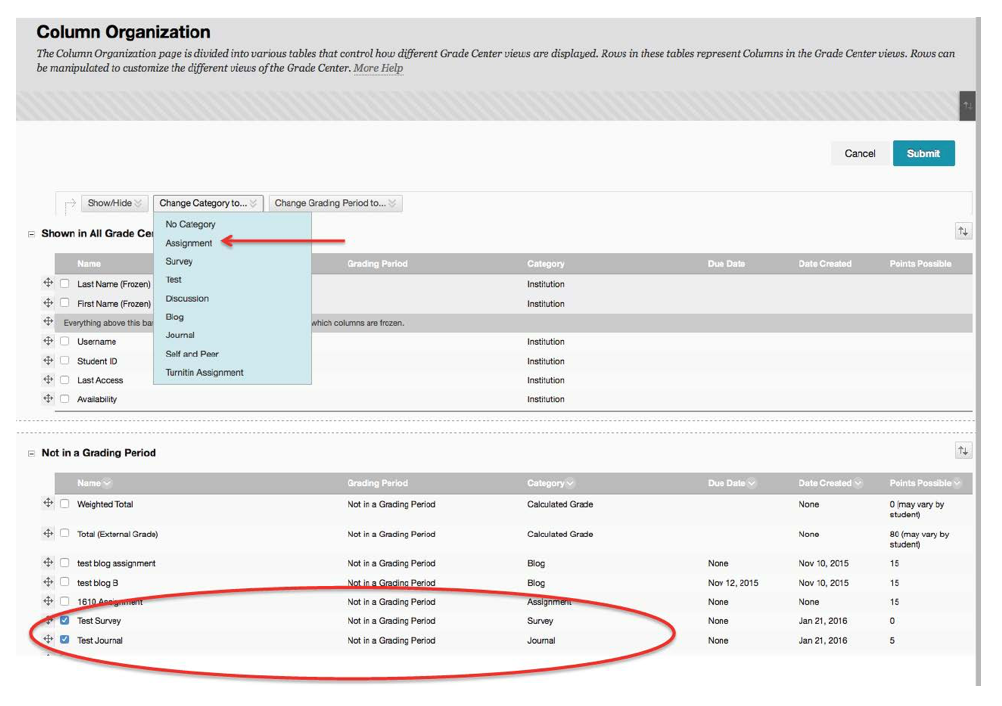
- 2. On the page where you see all columns, click the checkbox to select column(s) and select ‘Change Category’ to assign the column(s) to a specific category (g., Assignment). This option also allows you to check that all the columns for this category have been included. Click ‘Submit’ to save your changes.
3. While in ‘Full Grade Center’, select the drop down menu for ‘Create Calculated Column’ and select ‘Weighted Column’.
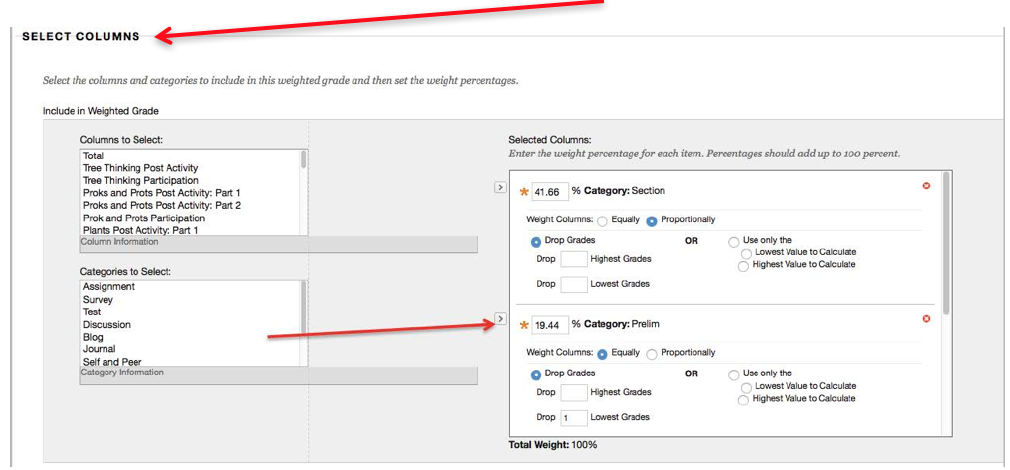
 4. Enter a column name (g., Final Grades), and scroll down to ‘Select Columns’.
- Select the ‘Category’ or ‘Column’ and then click on the right pointing arrow to move it to the ‘Selected Columns’ area.
- Enter the percentages for each category/item, checking that the Total Weight (at the bottom of the Select Columns area) adds up to 100%.
- Repeat this process as necessary.
- Select ‘Yes’, to calculate the weight as a running total to include only the columns that have been graded or select ‘No’ to include all columns[1],[2] and submit to save changes.
Note: (a) Once you select a category you will see options to drop the highest or lowest grades. (b) A grade column that is set to ‘No’ in the Include in Grade Center Score option will not display in the selection list.
Proportional weighting versus equally weighting categories for weighted grades.
Proportional vs. Equal weighting is a setting when you weight by category. It only makes a difference if you have columns with different points possible in the same category (e.g., a given Section Activity with a column worth 5 points and a column worth 15 points). If all of the columns in the category are equal, both settings work the same way.
When you have categories of differing values, Equal Weighting converts the columns to percentages and averages the percentages to get the category composite grade. It essentially gives each item equal weight when determining the composite grade. Proportional weighting calculates a category composite grade by adding the raw scores and dividing by the total points possible. It retains the proportional weight of each item, so items with a larger value have more effect on the composite grade.
For example, consider two assignments in a category, one worth 5 points and the other worth 10 points. Assume the student gets 5 points on each assignment.
Equal weighting: 5/5 and 5/10 = (100% + 50%) / 2 = 75% (i.e., converting it to equal Points Possible: 10/10 and 5/10 = 15/20)
Proportional weighting: 5/5 and 5/10 = 10/15 = 66.7%
The category composite grade is then weighted according to the percentage you indicated for the entire category and combined with the other columns or categories you have included in the Weighted Total.
Tip 8: Creating an Average Column in Grade Center
The average column is a type of calculated column that displays the average for a selected number of columns. For example, you can display the average for all tests or display the average grade for each student for a grading period. Only use this option if the total points possible for each column is the same.
To create an Average Column:
- In the Grade Center, point to ‘Create Calculated Column’ on the tool bar and click ‘Average Column’.
- On the Create Average Column page, type a brief, descriptive Column Name.
- In the ‘Select Columns’ section, select items to include in the average column’s calculation (g., ‘All Grade Columns’, ‘All Grade Columns in Grading Period’, ‘Selected Columns and Categories’)
- Calculate as a ‘Running total’ (running totals exempt cells that do not contain data. If you select no then a value of 0 will be used if no grade has been entered).
- Select the following options: include this column in Grade Center calculations, show this column to students, and if desired select show statistics (average and median).
- ‘Submit’
Tip 9: Creating a Minimum/Maximum column in Grade Center
The minimum/maximum column is a type of calculated column that displays either the minimum or maximum grade for a selection of columns (e.g., you can determine the lowest score earned by a student on all tests).
To create ‘Minimum/Maximum Columns’:
- In the Grade Center, point to ‘Create Calculated Column’ on the tool bar and select ‘Minimum/Maximum Column’.
- On the ‘Create Minimum/Maximum Column’ page, type a brief, descriptive ‘Column Name’.
- In the ‘Select Columns’ section, select ‘Calculation Type: Minimum or Maximum’.
- Select what to include in the minimum/maximum column’s calculation (g., all grade columns, Selected Columns and Categories).
- Calculate as a ‘Running total’ (running totals exempt cells that do not contain data. If you select no then a value of 0 will be used if no grade has been entered).
- Select the following options: include this column in Grade Center calculations, show this column to students, and if desired select show statistics (average and median).
- ‘Submit’
[1] If you are including ALL columns, make sure to select the “Exempt” option if you’re excusing a student from a given assignment.
[2] Make sure to enter zero for any assignment that a student did not turn in if you are using the running total option.
