Sebastian Cela1, Quirine Ketterings1, Karl Czymmek1,2, Melanie Soberon1, Caroline Rasmussen1
1Cornell University Nutrient Management Spear Program, 2PRODAIRY
Monitoring the nutrient status of dairy farms
A nutrient mass balance (NMB) is a useful tool to characterize the nutrient status of dairy farms (Soberon et al., 2013). The tool is most effective when farmers assess NMBs over several years. Such long-term trends allow farmers to evaluate the impact that specific management changes have had on the farm’s nutrient use efficiency, milk production, and potential for nutrient loss.
Feasible nutrient mass balances for New York
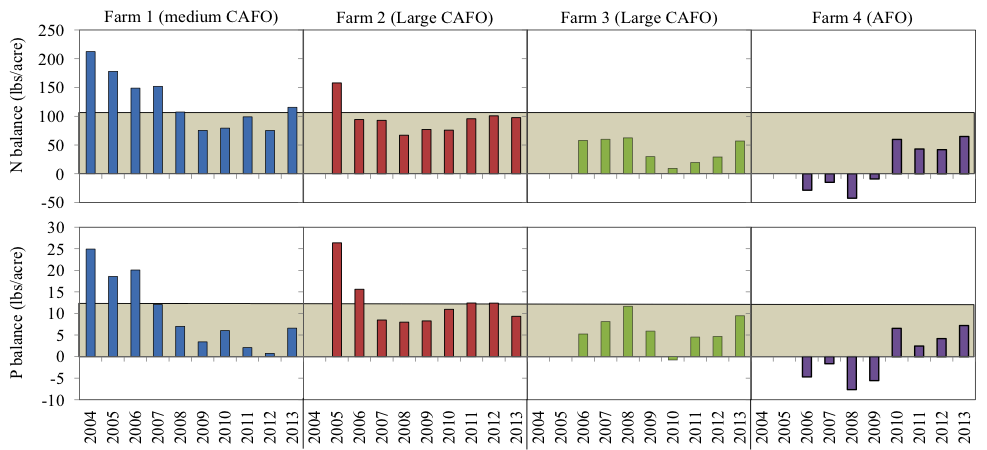
A previous What’s Cropping Up? article (Cela et al., 2015) reported a large range of NMBs per acre and per hundredweight (cwt) of milk across 102 dairy farms in New York. This study explored “feasible” NMBs for high-producing New York dairies as <105 lbs N/acre and <12 lbs P/acre, while the suggested targets per cwt were <0.88 lbs N/cwt and <0.11 lbs P/cwt. This information was obtained from NMBs on a single year (2006) and resulted in the definition of an “optimum operational zone” (operating below the feasible NMBs per acre and per cwt). A follow-up study (Soberon et al., 2015) reported that 63 to 96% of 54 New York dairy farms reduced NMB per acre over 4 to 6 years, and 55 to 61% of these farms simultaneously increased milk production per cow. In the current study, we evaluated if high-producing farms were able to consistently operate in the optimal operational zone and maintain or increase milk production over time.
Can dairy farms consistently operate with feasible mass balances?
Here we present the results of four dairy farms that assessed NMB over 8 to 10 years. Two of these farms decreased NMBs per acre and per cwt over time, a third farm always operated below the feasible balances suggested for New York, and the fourth farm increased NMBs over time (Fig. 1). Farmers made changes in NMBs that were directionally correct; the two farms that initially exceeded NMBs reduced them over time, whereas the farm that started with negative NMBs tended to increase its NMB (Fig. 1).

Can farms improve nutrient mass balances while increasing milk production?
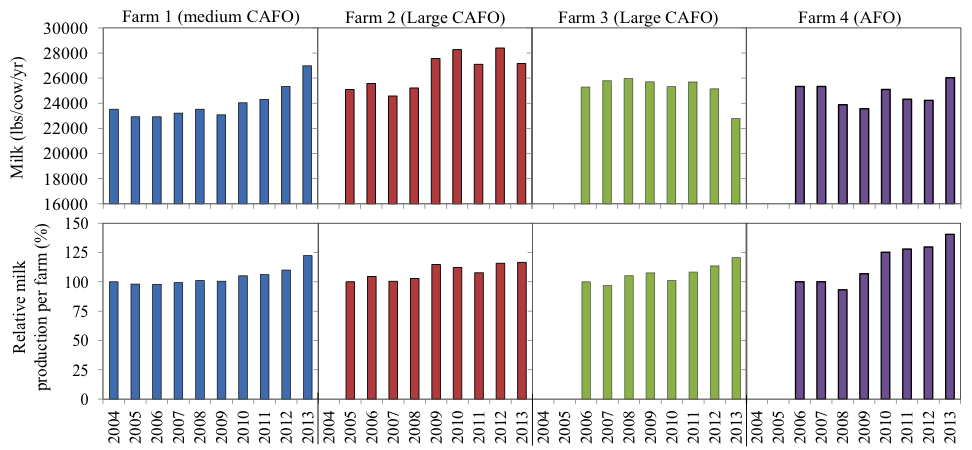
The four dairies increased their total milk production over time (Fig. 2) and had higher milk production per cow than the average of New York (~20,000 lbs of milk/cow per year). Milk per cow increased over time in farms 1 and 2, and was constant in farms 3 and 4 (Fig. 2). The exception was the last year for one of the large CAFOs (Farm 3). In this farm, milk production per cow was lower in 2013 reflecting discontinuation of the use of the rBST hormone. This 4-farm study shows that it is possible for high-producing dairy farms to consistently operate with NMBs per acre and per cwt within the feasible levels while maintaining or increasing milk production.

Specific management changes

Farmers made the largest changes on feed imports. Nutritionists formulated diets closer to animal requirements, resulting in a reduction in concentration of crude protein and P in the purchased feed over time. This was often achieved by reducing purchases of concentrates such as cottonseed, canola meal, and soybean meal, and replacing them these feed ingredients with blends with a lower nutrient concentration. This highlights the importance of precision feeding to improve NMBs. Other changes included reducing N fertilizer by eliminating starter N for corn for one of the farms, and reducing P fertilization by changing the corn starter blend from “20-20-0” (N-P2O5-K2O) to “5-0-8” on another farm. Changes in nutrient exports were usually small. Farms with low animal densities could export crops and this reduced the NMB. Farms with high animal densities (>1 AU/acre, or about 2 acres per cow + replacement) also exported manure, reducing the NMB. We did not measure economic indicators, but farmers made the changes on their own, and milk production remained the same or increased, reflecting win-win scenarios. As a result of these changes, all four dairies were able to operate in the optimum operational zone over the last years (Fig. 3).
We conclude that high-producing dairy farms in New York can consistently operate in the optimal operational zone (feasible NMB per acre and per cwt) and maintain or increase milk production over time. Annual NMBs can help identify if improvements can be made and be used to monitor the impact of management change on whole farm nutrient use efficiency over time.
Literature cited
Cela, S., Q.M. Ketterings, K.J. Czymmek, M.A. Soberon, C.N. Rasmussen (2015). Feasible whole farm nutrient mass balances for New York dairy farms. What’s Cropping Up? 25(2).
Soberon, M.A., S. Cela, Q.M. Ketterings, C. Rasmussen, and K.J. Czymmek. (2015a). Change in nutrient mass balances over time for 54 New York dairy farms. What’s Cropping Up? 25(3).
Soberon, M.A., Q.M. Ketterings, K.J. Czymmek, S. Cela, and C. Rasmussen (2015b). Whole farm nutrient balance calculator for New York dairy farms. What’s Cropping Up? 25(2).
Additional resources
Cela, S., Q. Ketterings, K. Czymmek, M. Soberon, and C.N Rasmussen. 2014. Characterization of nitrogen, phosphorus, and potassium mass balances of dairy farms in New York State. J. Dairy Sci. 97:1-19.
Soberon, M.A., S. Cela, Q.M. Ketterings, C.N. Rasmussen, and K.J. Czymmek. 2015. Changes in Nutrient Mass Balances over time and related drivers for 54 New York dairy farms. J. Dairy Sci. (in press).
Soberon, M.A., Q.M. Ketterings, C.N. Rasmussen, and K.J. Czymmek. 2013. Whole Farm Nutrient Balance Calculator for New York Dairy Farms. Nat. Sci. Educ. 42:57–67.
Acknowledgments
 Thanks to all the farmers, consultants, SWCD and NRCS staff, and Cornell Cooperative Extension educators that participated in this study. Thanks also to Françoise Vermeylen from the Cornell University Statistical Consulting Unit for statistical advice. This work was supported by grants from the Northern New York Agricultural Development Program (NNYADP), Northeast Sustainable Agriculture Research and Extension (NESARE), Federal-Formula Funds, and a USDA-NRCS Conservation Innovation Grant. For questions about these results contact Quirine M. Ketterings at 607-255-3061 or qmk2@cornell.edu, and/or visit the Cornell Nutrient Management Spear Program website at: http://nmsp.cals.cornell.edu/.

