Category Archives: Announcements

NEWA quality control

How does NEWA maintain its reliability? Uninterrupted model results during the growing season are critical for successful IPM and crop management. Accurate historical data are also important. Technology gremlins play games with our weather stations from time to time, so what can be done? Several methods of data quality control are used to maintain the integrity of information coming out of NEWA.

NEWA models utilize backup data

Most of the time, weather stations behave themselves. But once in a while, even the most well-maintained unit experiences a data outage. This might be due to a power loss, poor internet connection, or sensor failure. When a weather station is added to NEWA, a ‘sister’ station is assigned as a backup data source. Staff at the Northeast Regional Climate Center (NRCC) choose an alternate back up location based on similarities in microclimate and data output compared to the new location, rather than physical proximity alone.

If a station stops reporting data for a short period of time, NEWA will automatically substitute ‘sister’ station data into models so they continue to function properly. Models quickly become inaccurate and provide erroneous assessments without this important quality control measure. Model data substitution ensures the end user receives uninterrupted model results that are reasonably accurate.

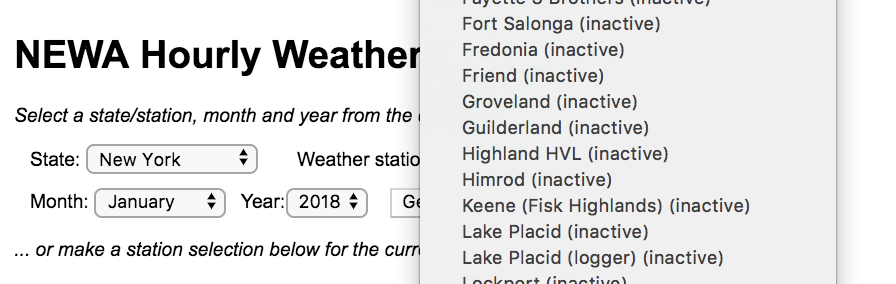
Weather station problems are usually resolved quickly. But if a station fails to report for a period of more than three weeks, it is placed on ‘inactive’ status. At that point, models can no longer be accessed from that location. When the station owner notifies NEWA that repairs have been made, the location is re-activated and models are again accessible to users.

Historical reports utilize backup data

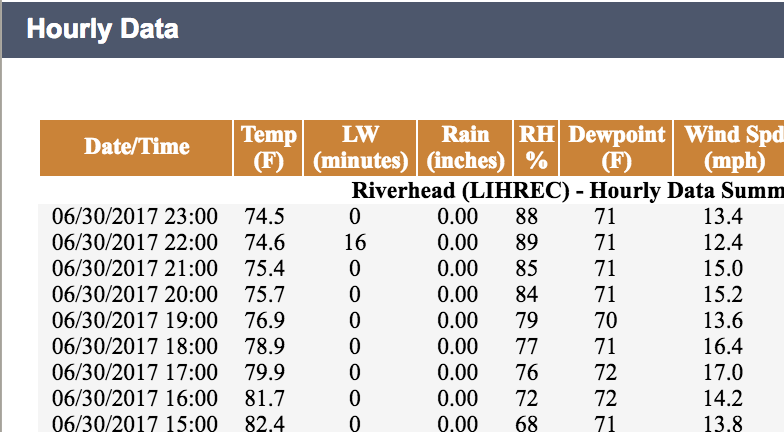
When you view historical data in hourly and daily weather summaries, certain records are sometimes displayed in brown italicized text. Data points marked in this fashion indicate substitution from a ‘sister’ station, as described earlier. The brown italicized data are the best guess approximation of actual conditions at that location and time. See the figure below.

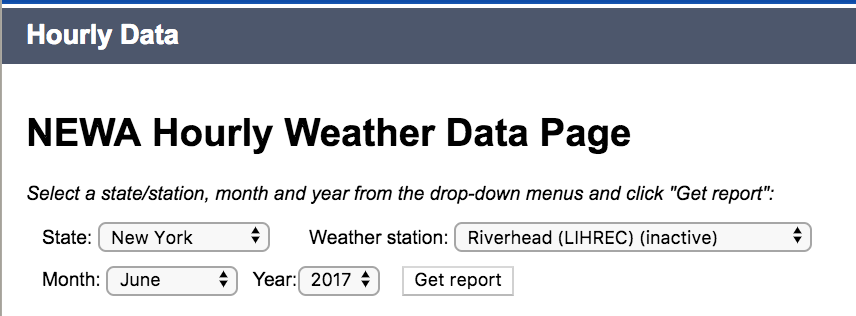
Sometimes, short-term outages create confusion for users when they try to access recent historical data in the hourly or daily summaries. If a station hasn’t reported recently, the tables will only display data up to the most recently reported day and time. Until the next data update is received from that station, the table will not contain current information.

Once an update does come in, NEWA will publish the new data record. If the weather station lost any data between the most recent reporting date and last recorded report, NEWA will pull brown italicized data from the ‘sister’ station to complete the historical dataset. The result is an unbroken continuous group of observations up to the current date and time.

Using NEWA to access historical data

Did you know NEWA can load past weather data into your favorite online tool at newa.cornell.edu? It’s the dead of winter which is a perfect time to look back at the 2017 growing season. Read this article to learn more about historical data access using NEWA.

Historical data access | Historical data from inactive stations | Historical data summary

NEWA historical data access

The NEWA website is popular because real-time weather data provide short-term risk assessments during the growing season. But, have you ever looked back and asked yourself what went right or wrong? NEWA tools can also be used to follow insect or disease risk historically through a period of time. You can access this feature using any model or tool available on the NEWA website.

Instructions

From the ‘Weather Data,’ ‘Pest Forecasts,’ or ‘Crop Management’ dropdown lists in the website navigation bar, select your model of interest.
 Select your pest or disease, State, and Weather station and historical Accumulation end date.
View the historical output.
 

NEWA historical data access from ‘Inactive’ Stations

Every once in a while, we get a question about historical data from an ‘inactive’ station, which is a NEWA location that no longer transmits to the website. Historical weather data can still be accessed using the hourly or daily weather summary tools.

Instructions

From the ‘Weather Data’ dropdown list in the website navigation bar, select Hourly Data or Daily Summary.
Scroll to the bottom of available weather stations and find a station of interest.
Choose a month and year from the past.
Get your report.

Historical data access summary

This table summarizes the availability of NEWA models and tools with ‘active’ and ‘inactive’ stations on NEWA. Follow the links to view tools and resources at the NEWA website.

Category Crop Model type Model From active stations From inactive stations
Fruit Apple Diseases Apple scab  YES NO
Fire Blight YES NO
Insects Apple Maggot YES NO
Codling Moth YES NO
Oriental Fruit Moth YES NO
Obliquebanded Leafroller YES NO
Plum Curculio YES NO
San Jose Scale YES NO
Spotted Tentiform Leafminer YES NO
Crop Management carbohydrate thinning model YES NO
Irrigation model YES NO
Grape Diseases Phomopsis YES NO
Powdery Mildew YES NO
Black Rot YES NO
Downy Mildew YES NO
Insects Grape Berry Moth YES NO
Vegetable Cabbage Insects Cabbage Maggot YES NO
Onion Diseases Botrytis YES NO
Downy Mildew YES NO
Purple Blotch YES NO
Insects Onion Maggot YES NO
Potato Diseases Early Blight YES NO
Late Blight YES NO
Tomato Diseases Early Blight, Septoria, Anthracnose YES NO
Late Blight YES NO
Weather Summaries Hourly YES YES
Daily YES YES
 Degree Days Summaries Monthly YES NO
 Calculator  YES NO


NEWA degree day models

Let’s take a closer look at how degree days are used on NEWA. My last post explained what they are, how they are calculated, and why they are used. But where and in what ways can they be accessed?

Every NEWA weather station has a unique ‘home page’ (Figure 1). This is an easy way to access degree day models during the growing season. When you follow a model link from the station page, results are automatically generated using data from that location.

Figure 1. This is the station home page for ‘Ithaca Cornell Orchards’ in New York State.

Degree-day models are also accessible from the navigation drop-down menus (Figure 2). This method requires user input to specify the station and location of interest. This gives you an opportunity to explore historical data, which is not an option when a model is accessed from a station home page as described above.

Figure 2. NEWA degree day tools can be accessed from the navigation drop-down menus.

The NEWA degree day calculator is a popular tool (Figure 3). Once the state, location of interest, desired base model, and start date is specified, custom degree day calculations are generated. For example, when a pre-programmed model is not available you can use the calculator as long as you understand which base temperature is needed. For more information about the degree day calculator, read this great post from April 2016 that provides more details. https://blogs.cornell.edu/yourenewa/2016/04/08/new-degree-day-calculator-on-newa/

Figure 3. The NEWA degree day calculator is a popular tool that provides customized calculations.

Here is a summary of current NEWA models and tools utilizing degree day calculations.

Category Model  Base temperature
Degree day calculator Customized degree day accumulation  User defined
 Degree days  Degree day monthly summaries  User defined
 Apple insects  Apple maggot  50°F/10°C
 Codling moth  50°F/10°C
 Obliquebanded leafroller  43°F/6.1°C
 Oriental fruit moth  45°F/7.2°C
 Plum curculio  50°F/10°C
 Spotted tentiform leafminer  43°F/6.1°C
 Apple diseases  Fire blight shoot symptom development  55°F/12.8°C
 Apple Scab  32°F/0°C
 Grape  Grape berry moth  47.14°F/8.4°F
 Vegetable  Cabbage maggot  39.2°F/4°C
 Onion maggot  40°F/4.4°C

For additional information about degree days on NEWA visit the URL link below.

About Degree days http://newa.cornell.edu/index.php?page=about-degree-days