Tag Archives: Degree days

Readers choice: degree day report options

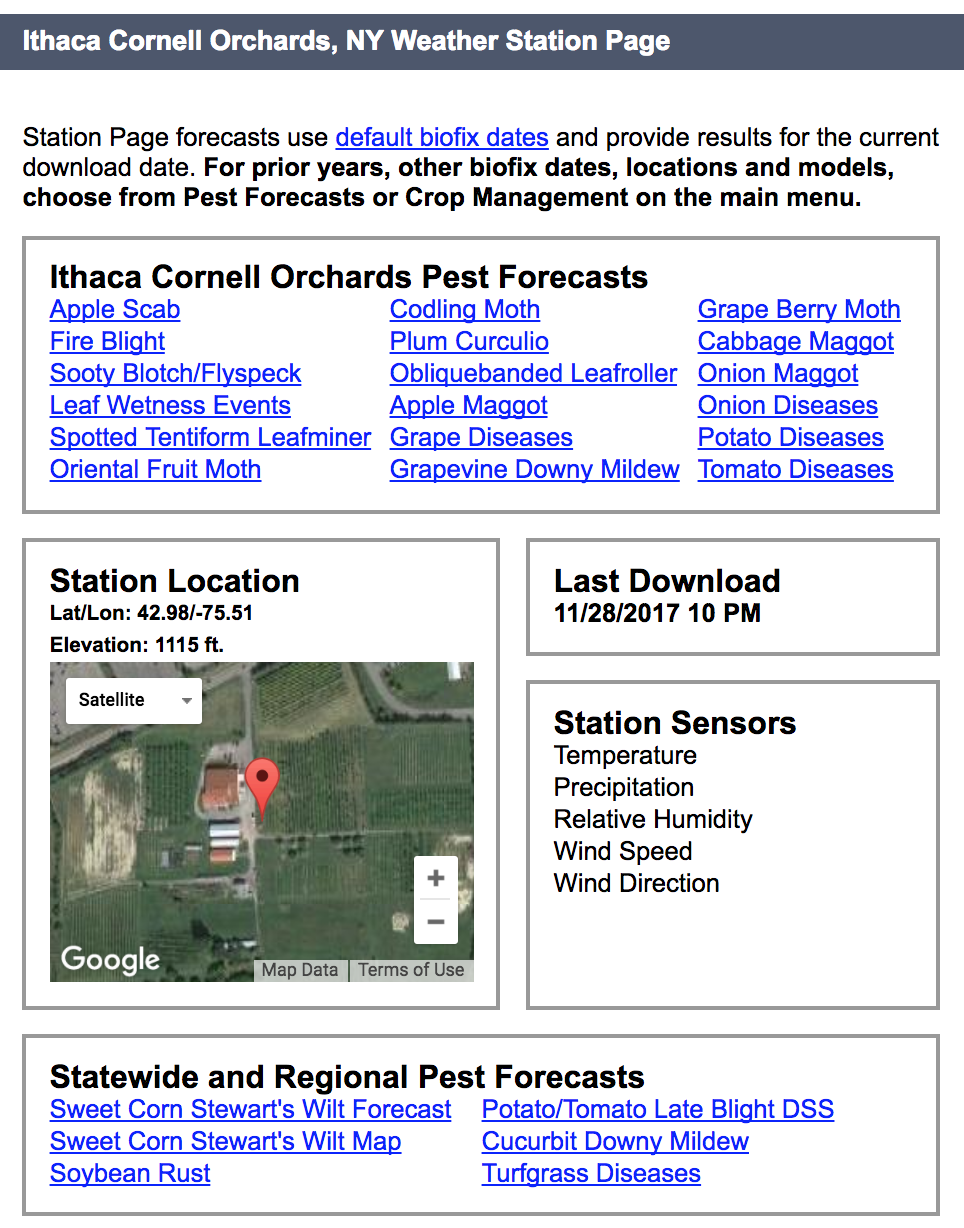
Alan Teach of Sunrise Orchards in Gays Mills, WI wrote in this week asking what the differences are between degree day reports shown on weather station pages (Figure 1). Let’s talk more about degree day models and the differences among those offered on NEWA.

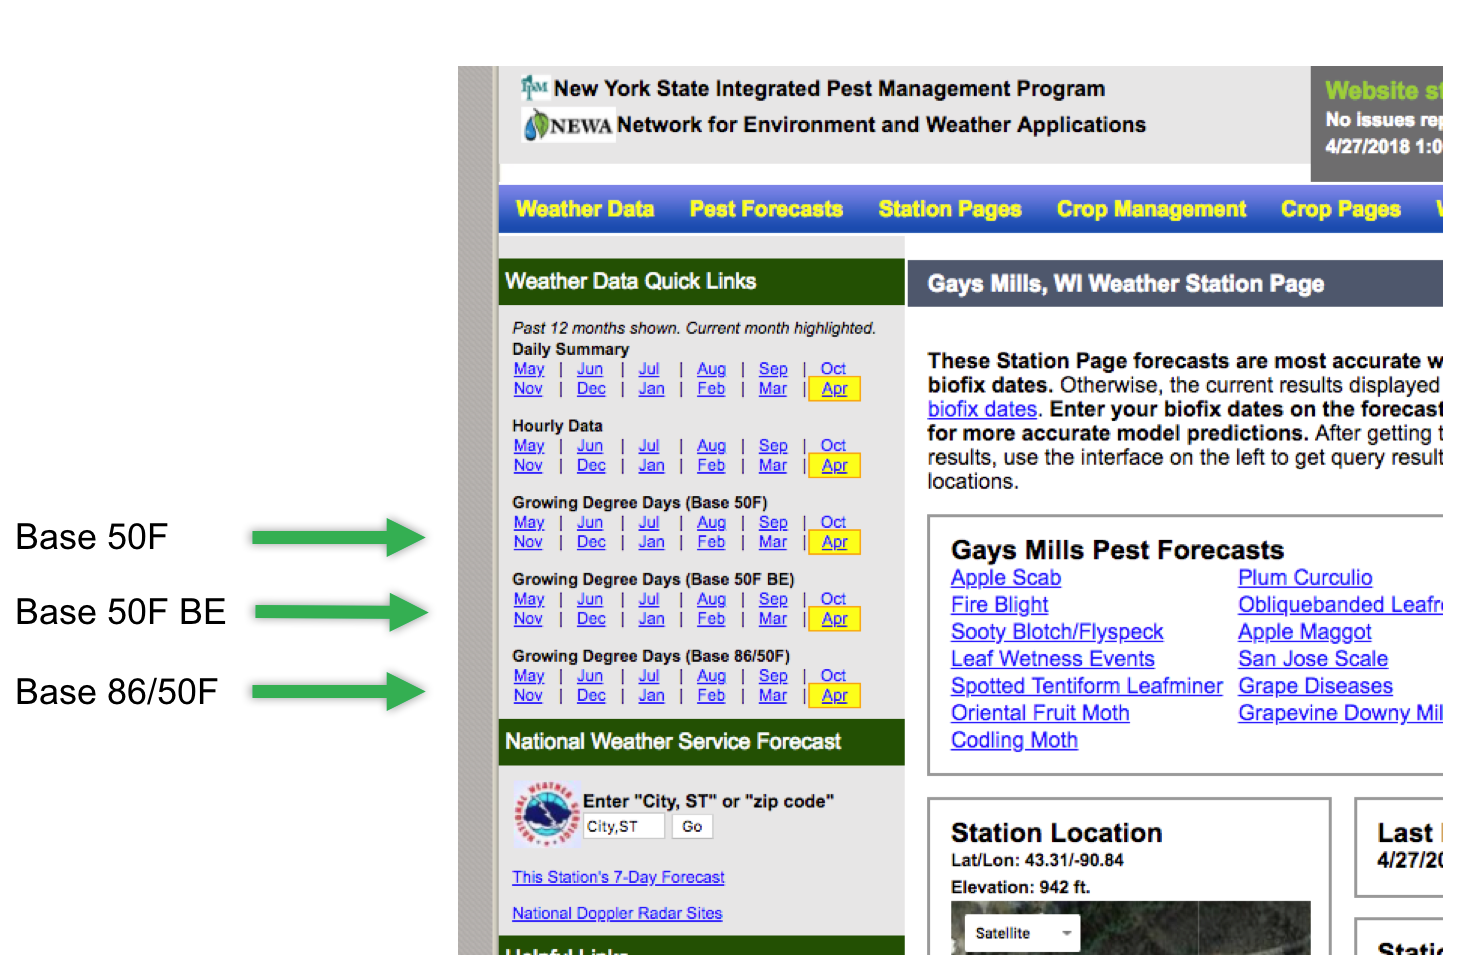
Figure 1. Three standard degree day reports are offered on NEWA weather station pages.

What is a degree-day model?

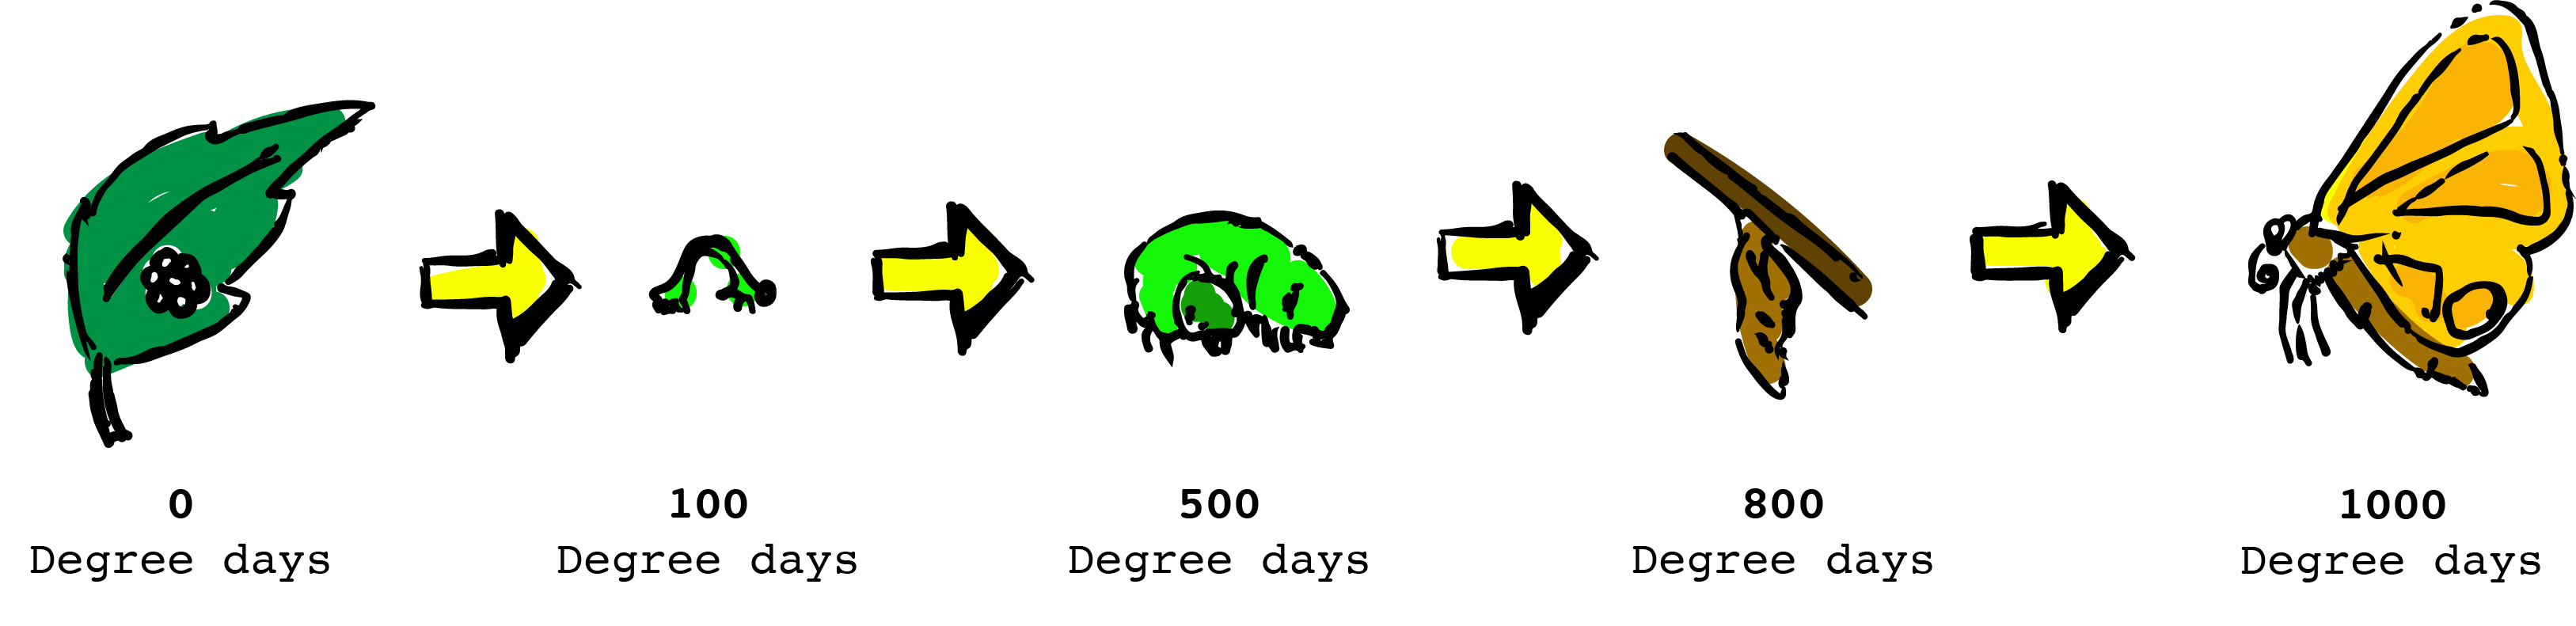
A degree-day model is used to estimate insect or plant development through different life stages. Basic parameters of a model include the minimum temperature at which growth can occur. This is termed the base temperature or lower development threshold. Sometimes a maximum temperature is also used, called the upper development threshold.

The simplest way to calculate degree days is a subtraction of the base temperature from the average temperature over a period of time. Consider the following example.

Day X has a minimum recorded temperature of 46F. Maximum temperature was 67F. Insect Y has a minimum development temperature of 50F. We calculate degree days on Day X for insect Y in the following way.

  1. Day X average temperature = (min TEMP + max TEMP)/2 = (46+67)/2 = 56.5F
  2. Insect Y degree days on Day X = average temp – base temp = 56.5F – 50F = 6.5 degree days

6.5 heat units are calculated for Insect Y on Day X. If temperatures are warmer, more units accumulate. If temperatures are colder, fewer. No heat units are accumulated if degree days are calculated to be less than 0. Development stops but does not reverse.

You can also review our overview of degree-day models on the NEWA website.

What’s the difference between model reports on weather station pages?

Allen’s question asks about differences between base 50F, base 50F BE, and base 85/50F reports. With a better understanding of how degree days are calculated, this question is more easily answered.

Base 50F

This model uses a base temperature of 50F. The example above calculated degree days in this manner. This is a common and straightforward method.

Base 50F BE

50F is also used as the base temperature in this model. BE is a reference to the Baskerville-Emin method of calculating degree days. The calculations look similar to the standard methods at temperatures well above threshold. For example when min temperature is 65F and max temperature is 85F.

But Baskerville-Emin is better at calculating accumulation on days where temperatures are close to the threshold. For example, consider a day when the minimum temperature is 40F and the maximum temperature is 60F. A basic degree calculation would show an accumulation of 0. In reality, some degree days are likely to have accumulated because a good portion of the day was in fact above 50F. Base 50F BE accounts for these close margins and should provide a more precise measurement of actual degree-day accumulation.

Base 85/50F

This model is similar to a base 50F model but also restricts accumulation by imposing an upper-temperature threshold. In the same way that degree day accumulation is restricted by a base temperature, accumulation of heat units is restricted when the maximum daily temperature approaches 85F. An 85/50F model is particularly suited to measurement of corn development for example.

Other degree day models

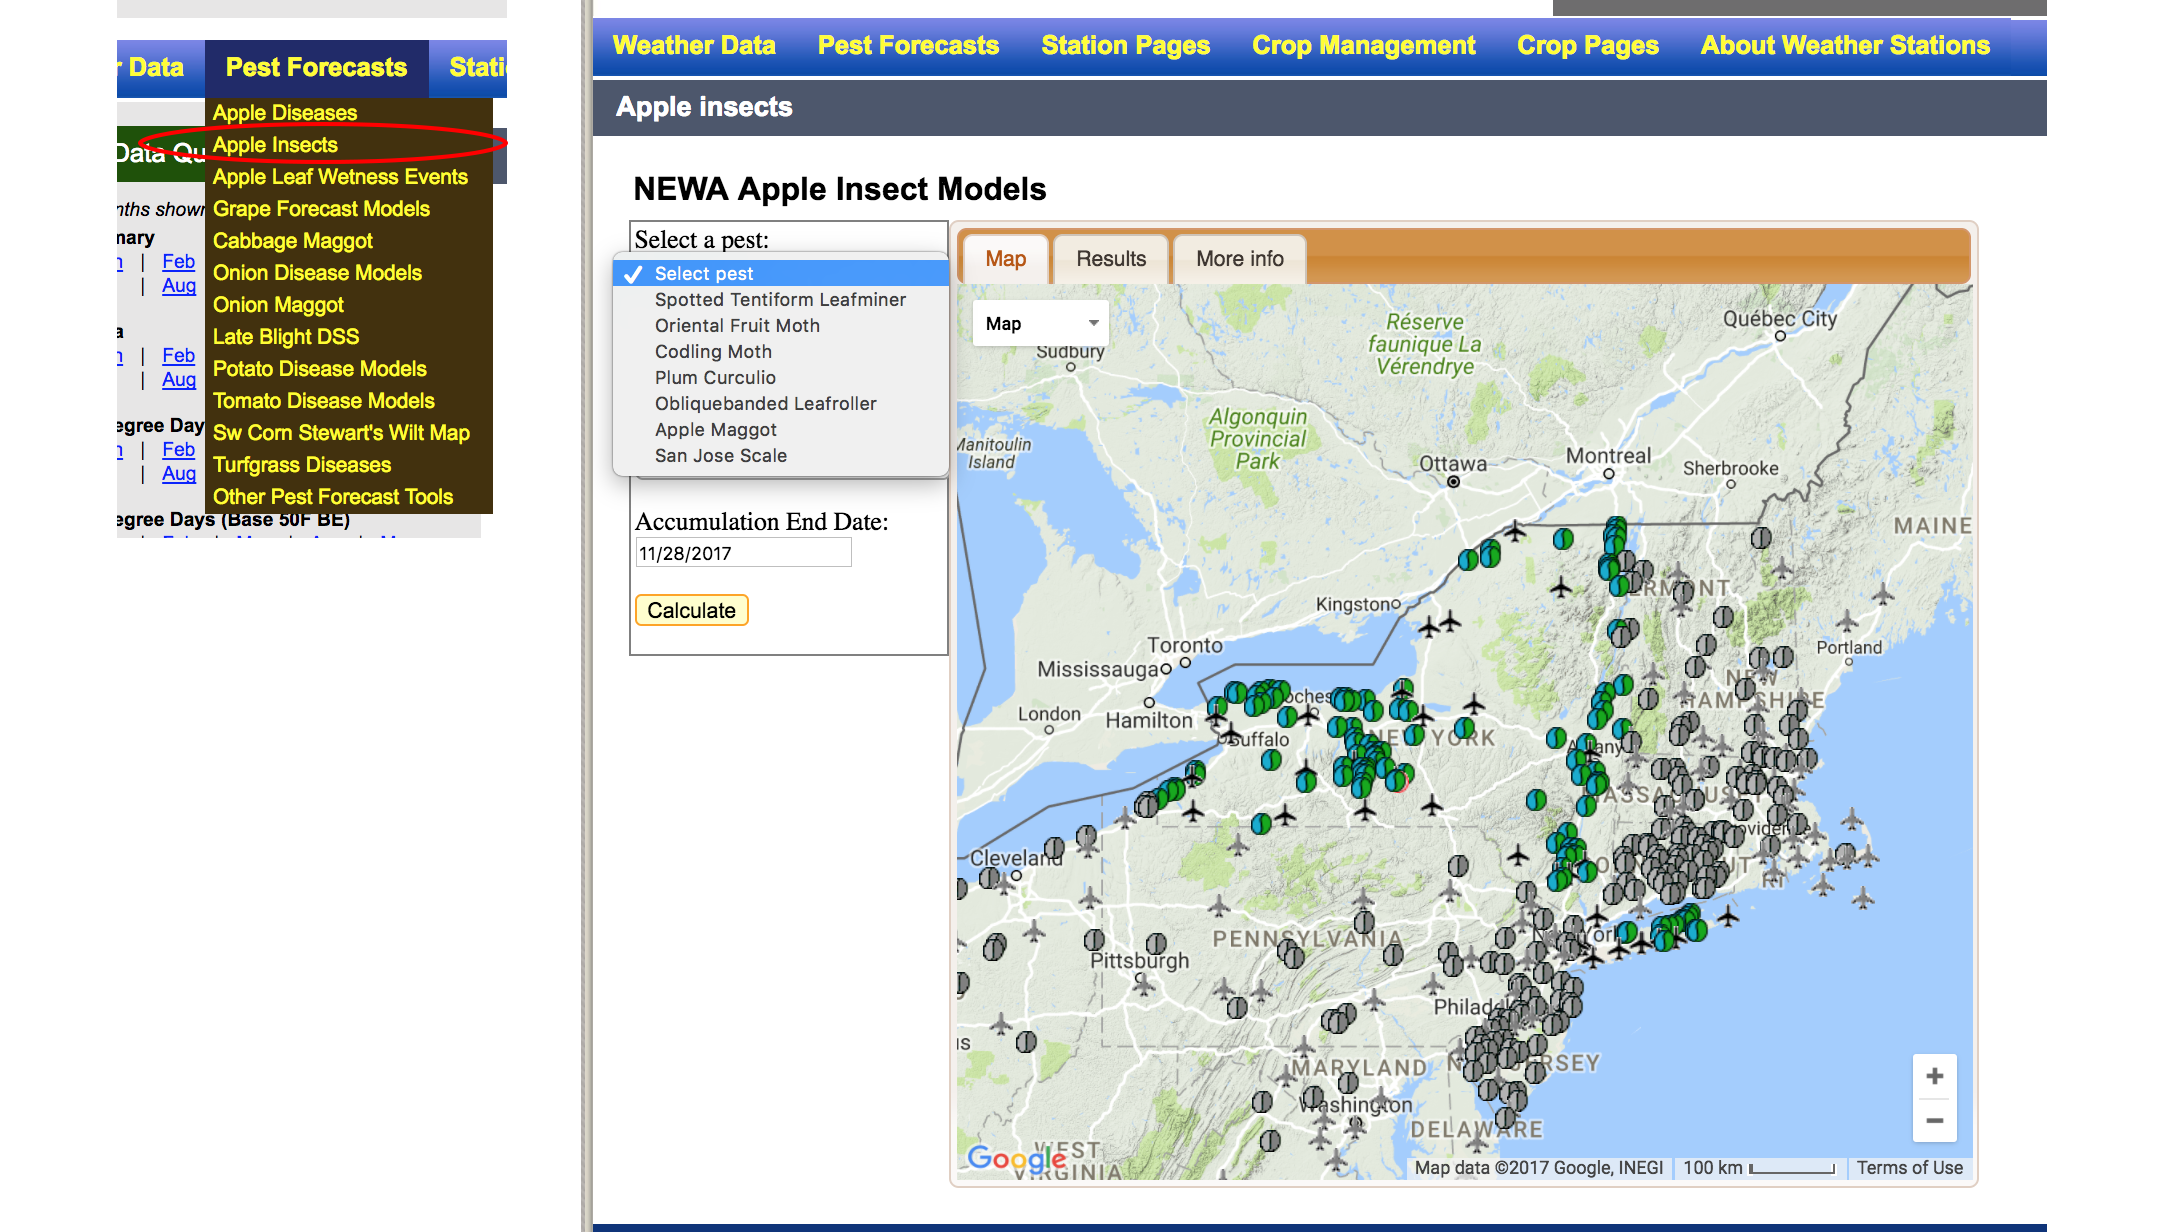
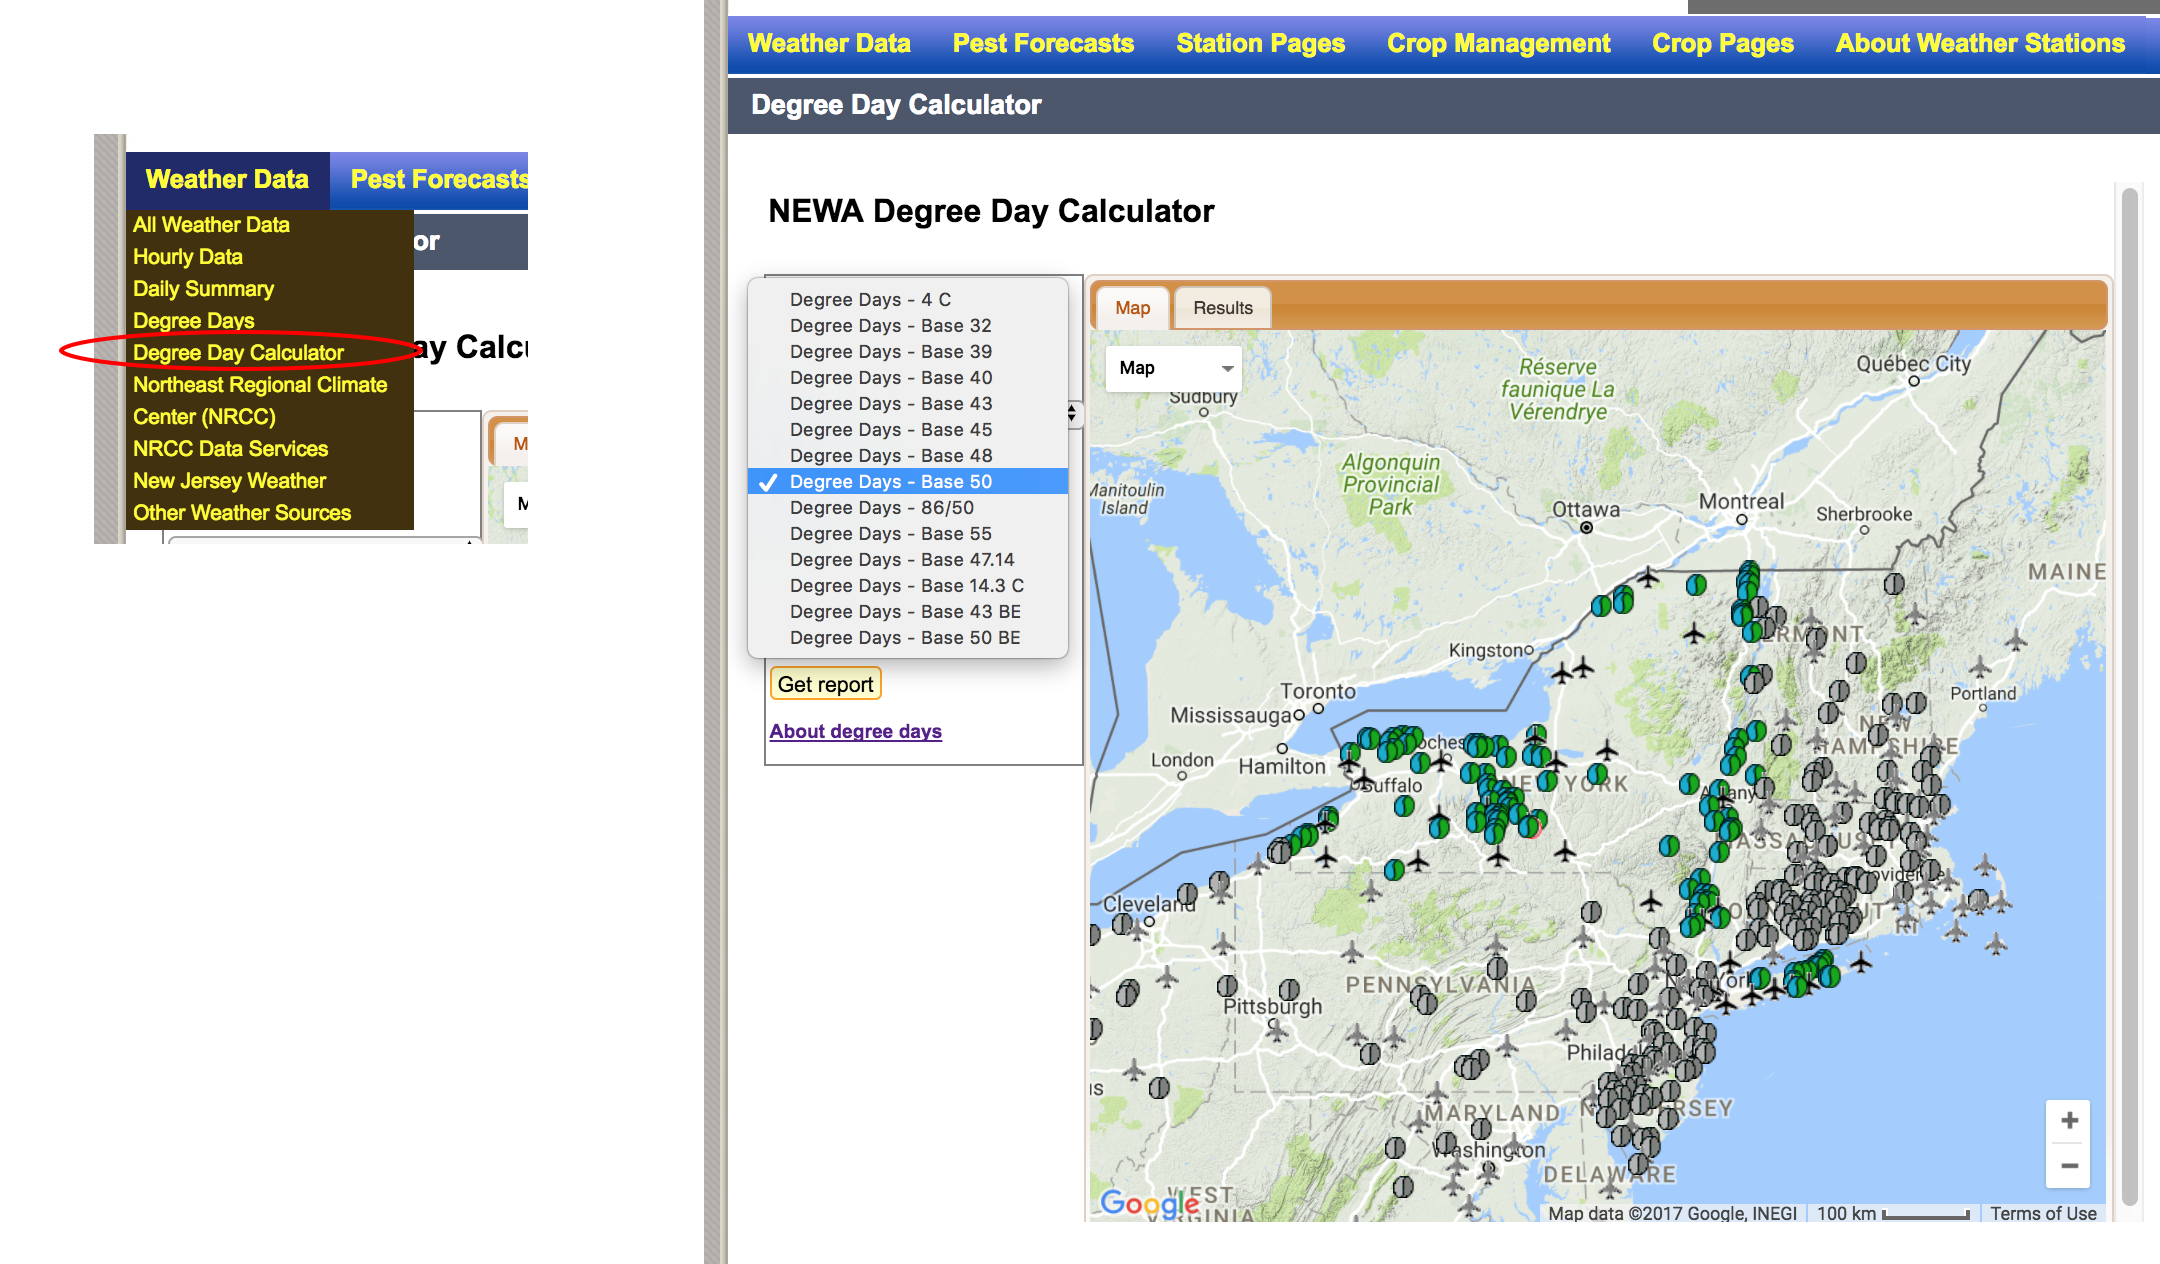
The most common degree-day models are directly available from weather station pages but the NEWA degree day calculator has many more options with a total of 14 available iterations of this model type (Figure 2).

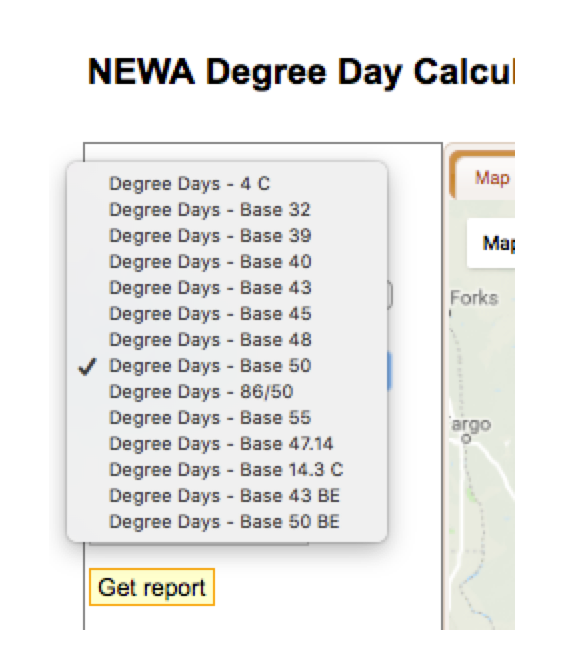
Figure 2. Fourteen degree-day models are available in the NEWA degree-day calculator.

This feature is available using data from any active NEWA location. Select the ‘Weather Data’ drop-down menu from NEWA’s main navigation bar and select ‘Degree Day Calculator.’ Choose your State, Weather station, Degree day type, accumulation start, and end dates and click ‘Get report.’

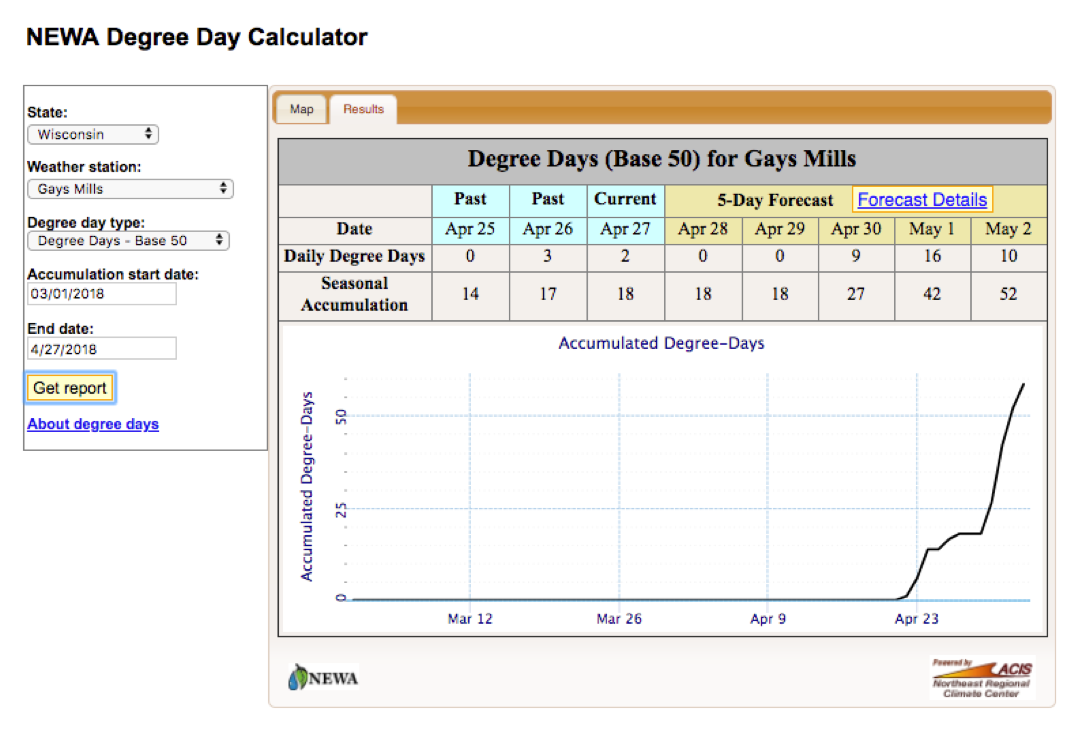
Figure 3. Snapshot report of customized degree day calculations from the NEWA degree-day calculator.

The output report provides a snapshot of your chosen degree day model accumulation for the past two days as well as a 5-day forecast. This model also works with historical dates, relabeling ‘5-day forecast’ as ‘Ensuing 5-days’ to indicate historical data.

Submit your ideas

If you have an idea or question for the NEWA blog, send a request to support@newa.zendesk.com or submit a request by following the ‘Help‘ link found in the main navigation bar at newa.cornell.edu.

NEWA degree day models

Let’s take a closer look at how degree days are used on NEWA. My last post explained what they are, how they are calculated, and why they are used. But where and in what ways can they be accessed?

Every NEWA weather station has a unique ‘home page’ (Figure 1). This is an easy way to access degree day models during the growing season. When you follow a model link from the station page, results are automatically generated using data from that location.

Figure 1. This is the station home page for ‘Ithaca Cornell Orchards’ in New York State.

Degree-day models are also accessible from the navigation drop-down menus (Figure 2). This method requires user input to specify the station and location of interest. This gives you an opportunity to explore historical data, which is not an option when a model is accessed from a station home page as described above.

Figure 2. NEWA degree day tools can be accessed from the navigation drop-down menus.

The NEWA degree day calculator is a popular tool (Figure 3). Once the state, location of interest, desired base model, and start date is specified, custom degree day calculations are generated. For example, when a pre-programmed model is not available you can use the calculator as long as you understand which base temperature is needed. For more information about the degree day calculator, read this great post from April 2016 that provides more details. https://blogs.cornell.edu/yourenewa/2016/04/08/new-degree-day-calculator-on-newa/

Figure 3. The NEWA degree day calculator is a popular tool that provides customized calculations.

Here is a summary of current NEWA models and tools utilizing degree day calculations.

Category Model  Base temperature
Degree day calculator Customized degree day accumulation  User defined
 Degree days  Degree day monthly summaries  User defined
 Apple insects  Apple maggot  50°F/10°C
 Codling moth  50°F/10°C
 Obliquebanded leafroller  43°F/6.1°C
 Oriental fruit moth  45°F/7.2°C
 Plum curculio  50°F/10°C
 Spotted tentiform leafminer  43°F/6.1°C
 Apple diseases  Fire blight shoot symptom development  55°F/12.8°C
 Apple Scab  32°F/0°C
 Grape  Grape berry moth  47.14°F/8.4°F
 Vegetable  Cabbage maggot  39.2°F/4°C
 Onion maggot  40°F/4.4°C

For additional information about degree days on NEWA visit the URL link below.

About Degree days http://newa.cornell.edu/index.php?page=about-degree-days


Degree days at a glance

What are degree days and why do we use them? Degree days are an important part of many NEWA tools, but what are they and whey do we use them?

Insect and plant development is controlled by temperature. Warmer temperatures speed development while colder temperatures slow development. This relationship can be used to track the life cycle of an insect or plant with something called a degree-day model.

A degree day is a unit of measurement that is species-specific and represents some proportion of overall insect or plant development. Degree days are calculated by using maximum and minimum temperature to calculate a daily average, then subtracting a base temperature. NEWA weather stations provide daily temperature information to track pest development, and the rate of degree-day accumulation is unique for each location. It also helps to think of degree days as accumulated points, not accumulated days.

Different insects have a different degree day requirements. This caterpillar pest has a base temperature of 50 degrees Fahrenheit (or 10 degrees Celsius) and a developmental requirement 1000 ‘base 50F’ degree days from egg to adult. Image Copyright Dan Olmstead NYS IPM Program.

For a long time, pest management information learned from our parents and grandparents was accurate. But now, the weather is less predictable, especially in the last five or ten years. (And new pests have emerged.) Sadly, cross-generational knowledge is becoming less reliable. Degree-day models are now the best basis for agricultural pest management decisions.

A farmer is going to see changes in pest pressure, planting time, or crop development from one year to the next. Degree-day models, combined with modern technology, give growers a better estimate of pest status. There is still variability, but he or she is better informed to make effective management decisions.

Degree day requirements for an insect won’t change. But the time needed to gather those degree days is variable.

Up next, we will take a closer look at degree day tools available on NEWA.