Monthly Archives: November 2018

The 2017 NEWA Survey: IPM impact

This is part three in a five-part blog series discussing 2017 NEWA survey results of users and non-users. Download the full report to learn more.

By Dan Olmstead and Julie Carroll

IPM impact

“This [NEWA] is a great tool. Timing is everything, especially with chemicals that don’t last very long. NEWA is very helpful in determining when to spray.”

“NEWA is an indispensable tool for apple growers – used daily in the spring and every few days in the summer. Apple scab and fire blight models are extremely useful – many other models as well.”

– NEWA users who completed the 2017 survey

NEWA is a reliable and trusted source of information among users. All respondents said they would recommend NEWA to other growers. They also said NEWA provides reliable IPM information to support responsible management practices, enhance decision-making, and increase awareness of risks. When asked directly if NEWA helps you to improve timing of pesticide applications, 96% answered yes. Growers use NEWA to improve pesticide application timing, reduce spray applications, and reduce crop loss. These findings were consistent with 2007 survey results (Fig. 1 A and B).

Among NEWA users responding to the survey, more strongly agreed in 2017 that NEWA has a positive impact on IPM practices than did in 2007, though combined results were similar:

  • 77% agreed or strongly agreed that NEWA pest forecast information helps them reduce the number of sprays they apply to control diseases, insects, mites, or weeds, compared to 81% in 2007.
  • 86% agreed or strongly agreed that NEWA pest forecast information alerts them to the risk of pest damage, compared to 90% in 2007.
  • 93% agreed or strongly agreed that NEWA pest forecast information enhances IPM decision-making for their crops, compared to 96% in 2007.
  • 95% agreed or strongly agreed that NEWA pest forecast information improves timing of their spray applications (fungicides, insecticides, miticides, or herbicides), compared to 93% in 2007.

As a direct result of using NEWA pest forecast tools, 75% of growers are saving money on their spray bill. Grower respondents to the 2017 survey estimated annual savings of, on average, $4,329 from reducing pesticide sprays. In 2017, the pest forecast tools on NEWA also helped growers prevent, on average, $33,048 in crop loss annually. Translating costs into per acre savings, 44 respondents reported an average per acre savings of $2,060 annually, through reduced sprays and avoided crop loss.

Up next: Use of NEWA models, tools, and resources
The 2017 NEWA survey: current and potential users

This is part two in a five-part blog series discussing 2017 NEWA survey results of users and non-users. Download the full report to learn more.

By Dan Olmstead and Julie Carroll

Who uses NEWA?

75% of all NEWA users are growers and 10% are extension educators. Of the growers, 60% manage diversified farm operations. The size of their farms ranged mostly from 11 to 1000 acres (57% of respondents), with a small proportion (4%) managing farms greater than 1000 acres, and 20% farming 2 to 10 acres. Among non-users, the majority of respondents (44%) farmed less than 10 acres.

What do NEWA users produce?

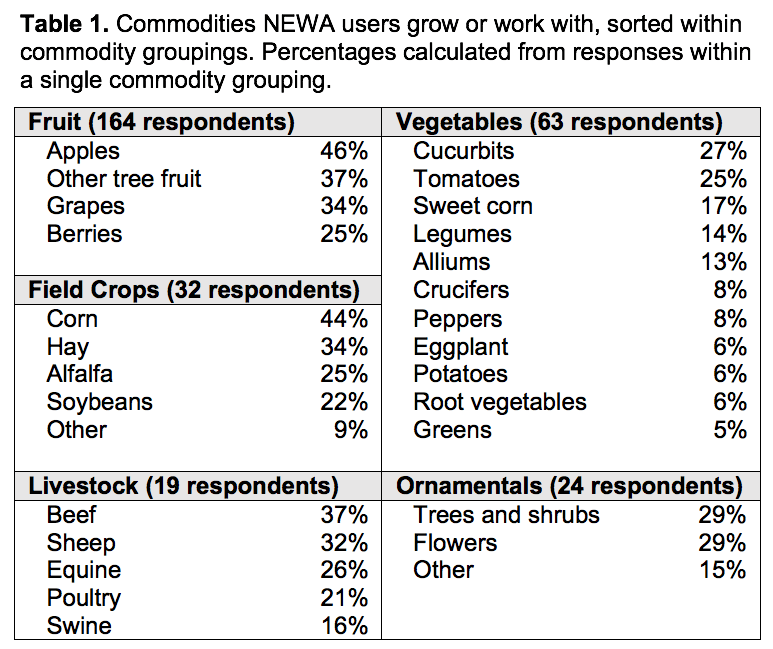
Most NEWA users surveyed grow apples (46%); other tree fruit (37%); grapes (34%); berries (25%); and tomatoes (25%). A majority produce two or more commodities; 23 other commodities not supported by commodity-specific NEWA tools were reported by NEWA users (Table 1).

NEWA currently provides fruit and vegetable tools, whereas the survey results show users produce other commodities. Therefore, additional NEWA tools for field crops, livestock and ornamentals are needed, as well as for other fruit and vegetables not covered. Users who manage diversified operations will benefit from NEWA tools in these production areas and an interface that displays the results for several models simultaneously.

Future growth opportunities

Of the 331 survey respondents, 151 do not use NEWA. A majority (59%) of non-users indicated a lack of awareness when asked why they don’t use NEWA. Another 25% responded by saying they don’t know how to use NEWA. Coordinated effort to increase NEWA awareness is needed. Educational resources, workshops, and presentations would help recruit NEWA users who could benefit from its impact on improving their IPM practices.

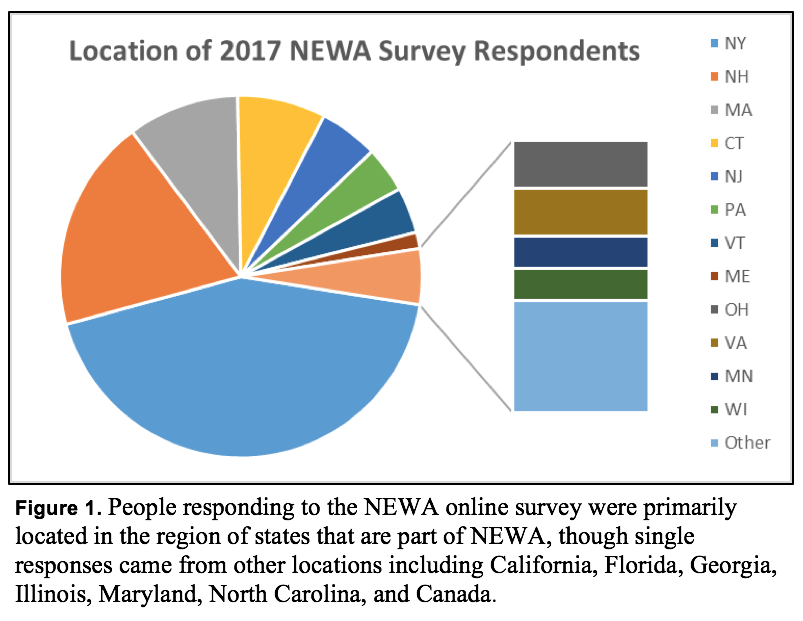
Geographic representation

Up next: NEWA IPM impact


The 2017 NEWA user survey: understanding grower impact, needs, and priorities

This is part one in a five-part blog series discussing 2017 NEWA survey results of users and non-users. Download the full report to learn more.

By Dan Olmstead and Julie Carroll

Survey background and justification

NEWA is an online decision aid system providing fruit and vegetable growers with IPM risk assessment model results based on local weather and forecast data. First established in 1996 by the New York State IPM Program at Cornell University with 22 weather stations, the current NEWA web platform, newa.cornell.edu, was launched in 2009; informed by a 2007 survey of NEWA users and non-users.

The success of the NEWA platform paved the way for significant expansion in the ensuing 10 years. NEWA now includes over 650 weather stations throughout the Northeast, Mid-Atlantic, and Upper-Midwest US. At the time of this post, there are 14 partnering states with membership support from land-grant institutions and grower associations, including Connecticut, Massachusetts, Michigan, Minnesota, New Hampshire, New Jersey, New York, North Carolina, Ohio, Pennsylvania, Vermont, Virginia, West Virginia, and Wisconsin.

A 10-year follow up survey was completed in 2017 to gather NEWA user and non-user demographics, measure IPM impact, determine current and desired user needs, and assess the overall NEWA user experience. Collected data is informing a NEWA redesign planned for 2019 to best address grower preferences, capitalize on new internet technologies, accommodate mobile devices, and deliver attribution to and resources from partner states.

Survey objectives included the following:

  1. Measure the IPM and financial impact of NEWA.
  2. Understand the demographics of NEWA users and potential new users.
  3. Determine the utility of current website content, desired new content, and assess user experience. 

Survey implementation

Survey questions about user demographics, website content needs, and user experience were drafted by Olmstead, Carroll, and NEWA State Coordinators with final review by Cornell Survey Research Institute. To provide a 10-year perspective on NEWA’s impact, a subset of questions from the 2007 survey was repeated in the 2017 survey.

Next up: Understanding IPM impact among NEWA users