This is part two in a five-part blog series discussing 2017 NEWA survey results of users and non-users. Download the full report to learn more.
By Dan Olmstead and Julie Carroll
Who uses NEWA?
75% of all NEWA users are growers and 10% are extension educators. Of the growers, 60% manage diversified farm operations. The size of their farms ranged mostly from 11 to 1000 acres (57% of respondents), with a small proportion (4%) managing farms greater than 1000 acres, and 20% farming 2 to 10 acres. Among non-users, the majority of respondents (44%) farmed less than 10 acres.
What do NEWA users produce?
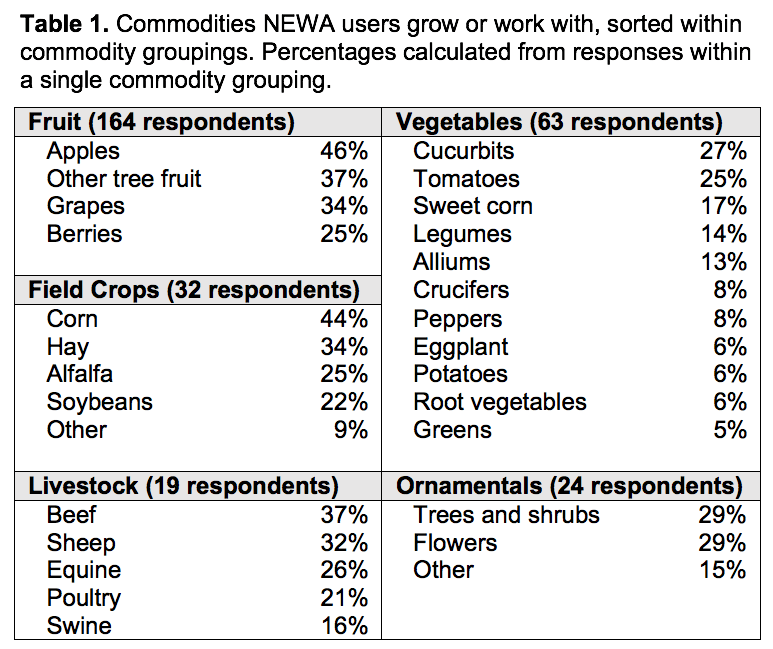
Most NEWA users surveyed grow apples (46%); other tree fruit (37%); grapes (34%); berries (25%); and tomatoes (25%). A majority produce two or more commodities; 23 other commodities not supported by commodity-specific NEWA tools were reported by NEWA users (Table 1).
NEWA currently provides fruit and vegetable tools, whereas the survey results show users produce other commodities. Therefore, additional NEWA tools for field crops, livestock and ornamentals are needed, as well as for other fruit and vegetables not covered. Users who manage diversified operations will benefit from NEWA tools in these production areas and an interface that displays the results for several models simultaneously.
Future growth opportunities
Of the 331 survey respondents, 151 do not use NEWA. A majority (59%) of non-users indicated a lack of awareness when asked why they don’t use NEWA. Another 25% responded by saying they don’t know how to use NEWA. Coordinated effort to increase NEWA awareness is needed. Educational resources, workshops, and presentations would help recruit NEWA users who could benefit from its impact on improving their IPM practices.
Geographic representation
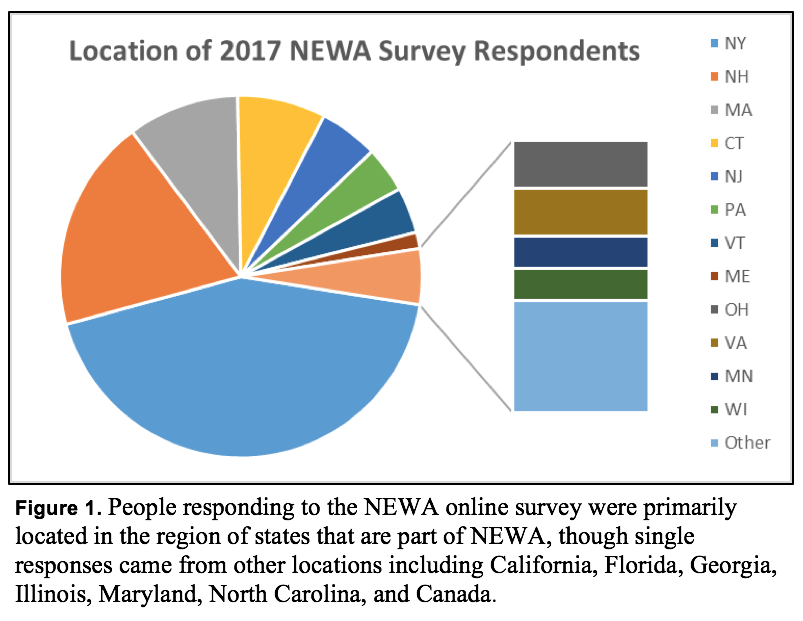
Up next: NEWA IPM impact