Lindsay Fennell, Bob Schindelbeck, Aaron Ristow, and Harold van Es Soil and Crop Sciences Section, Cornell University
Chuck Sherzi Jr. Sherzi & Company, LLC
Introduction
Soil health has recently captured the attention of farmers in the U.S. and internationally, yet there are many applications that expand beyond the field of agriculture. The green urban landscape has great potential for improving soil quality. In city parks and greenways, compaction from both human and machine activity, and the mixing of topsoil and subsoil during routine park maintenance can affect soil functions such as plant growth, water infiltration, and the support of biological life. Although soil degradation is visible in many parks, a systematic approach to characterize soil health has only recently been applied to urban landscapes.
Cornell University’s Comprehensive Assessment of Soil Health (CASH) provides an assessment of soil health relative to important soil physical, chemical and biological processes. In both rural and urban settings, chemical indicators such as pH and macro/micro nutrients are often at optimal levels due to lime and fertilizer applications, yet the soil itself can still be physically and biologically degraded. CASH provides a full picture of what’s going on below the surface. It outlines the interconnected processes causing constraints, which in turn empowers land managers to make informed decisions about soil amelioration and future maintenance.
By promoting urban soil health, cities can create positive environmental outcomes such as flood protection, groundwater recharge, and sequestration of dust and carbon, while providing a more comfortable urban climate through healthy plants. Recently, CASH was evaluated as a tool for a renovation project in Boston, Massachusetts, which is a notable example of the application of the test for soil health management in city parks.
Case Study: Winthrop Square Park
Pocket parks (or mini parks) play an important role in city life, whether it’s sitting on a park bench, strolling through a bit of green in an urban jungle, or the neighborhood kids playing a game of kickball. These small parks, sometimes no larger than ¼ acre, provide a safe and inviting environment for community members. They support the overall ecology of the surrounding environment, landscape and heritage, and empower local residents to make decisions that affect their community. Boston has hundreds of these outdoor parks all over the city, and one of the oldest and most beloved is Charlestown’s Winthrop Square Park.
Figure 1 1852 McIntyre map of Boston showing the Training Field in relation to City Square and the Bunker Hill monument. By this time the Training Field site was becoming more park-like. Photo taken from the Cultural Landscape Plan for Winthrop Square Park.
The park, also known as the “Training Field”, is a .89 acre green space with a 400 year history. It was a training ground for colonial militia in the 1640’s, was witness to the Battle of Bunker Hill in 1775, served multiple functions as a civic space throughout the centuries, and most recently became a hotspot for Charlestown residents and a stop along the Freedom Trail. Although this space is deeply significant to the community and the city itself, it has been many years since restorations took place. Along with other much needed rehabilitation work, it faced drainage and erosion problems, and the overall soil health was lacking in many areas.
The park renovation project developed out of a cultural landscape report, prepared by Kyle Zick, Landscape Architect, and Shary Page Berg, Landscape Preservationist, in partnership with two local community groups, the Charlestown Preservation Society and the Friends of the Training Field. The Boston Parks and Recreation Department led the way and a park renovation proposal was approved by the City, along with $690,000 from its Capital Budget.
Site Analysis
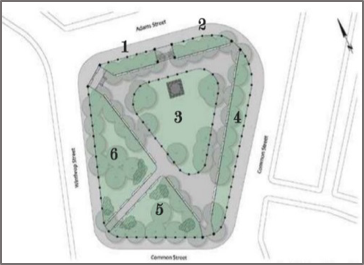
Figure 2 Aerial view of the park and the six unique sampled areas
Sherzi & Company LLC was part of the consulting team brought in to address the drainage and soil health issues at the site. Owner Chuck Sherzi had extensively used the CASH approach in previous projects, and recommended to employ this holistic approach to address the concerns facing the park. The complete diagnostic report included data analysis and interpretations from the Cornell Soil Health lab, site observations, and a detailed summaries of suggested recommendations and appropriate construction materials. Since the site is naturally divided into six unique areas and each had a specific set of challenges (foot traffic, grade elevation, water flow, etc.), separate soil samples were collected from each area (Figure 2).
The Comprehensive Assessment of Soil Health
The CASH approach emphasizes the integration of soil biological, physical, and chemical measurements. These include soil texture, available water capacity, soil penetration resistance (compaction), wet aggregate stability, organic matter content, soil proteins, respiration, active carbon, and macro- and micro-nutrient content (see soilhealth.cals.cornell.edu/ for more details). The results are synthesized into a comprehensive soil health report with indicator scores, constraint identification, and management suggestions. The report can be used by consultants and managers as a baseline assessment and to guide soil amelioration and future management.
Winthrop Square Soil Health Results
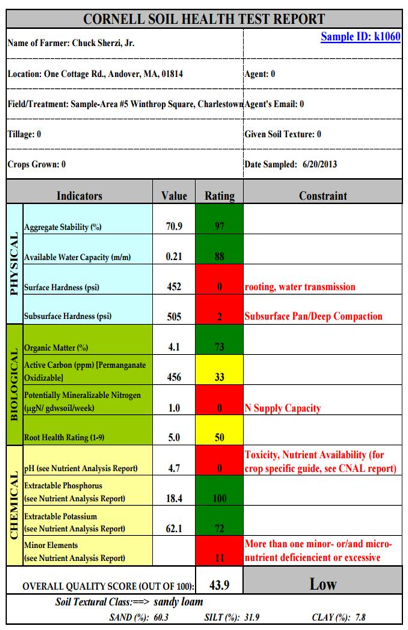
The entire site showed soil health concerns, with overall quality scores of low to medium. Specifically, the CASH reports (Figure 3) showed:
Physical Indicators
Figure 3 Summary page from the Area 5 Soil Health report
Aggregate stability (indicating soil resistance to disintegration from rainfall) and available water capacity (indicating the soil’s ability to store water) scored high on all six assessments, possibly a result of minimal soil disturbance at the site over the years.
Surface (0 – 6 inches) and subsurface (6 – 18 inches) hardness (indicating compaction that limits root growth, water transmission and plant access to nutrients and water) scored mostly low and medium throughout the site.
Biological Indicators
The indicators generally scored medium or low, suggesting marginal soil biological activity. Although several areas tested within range for total organic matter, active carbon was constrained at four sites, indicating a lack of biologically available food and energy within the organic matter.
All six areas scored medium in the root health rating, most likely due to compaction.
Chemical Indicators
pH and minor elements scored low or medium in five of the six areas.
Heavy metals in all areas were found to be within the allowable concentrations for garden soil and were therefore not a concern for this project.
Example of Detailed Problem Spot: Area #5 (Figure 3)
Area 5 was the second largest of the areas assessed, experiencing a high amount of foot traffic and patchy consistency throughout. It had the lowest soil health score, with the major constraints being surface and subsurface compaction. While the organic matter scored high, other biological indicators were relatively low. The sandy loam texture could be a factor in the loss of nutrients through leaching, and the low nutrient base cations Mg++ and Ca++ could be associated with a low pH. A layered approach was proposed for Area 5 and all other areas assessed.
Recommendations and Implementations
Results of the assessment highlighted soil compaction as the major underlying constraint common to all six of the Winthrop Square areas. Issues with the physical structure of soil eventually leads to negative impacts of both biological and chemical components. Compacted soils have decreased pore space that can limit infiltration, increase runoff and erosion potential, and allow for anaerobic conditions that are unfavorable for beneficial microbial communities. They can also limit plant access to nutrients and water. Given these results, recommendations for the site were focused on decompaction measures followed by incorporation of organic amendments to improve nutrient cycling, pH, and the overall biological health of the soil. Sherzi also recommended amending the sandy loam soil with biochar and a green manure to break up the surface hardness, aid in nutrient retention and further prevent runoff and erosion.
Soil Decompaction Techniques
A multi-tiered approach was used to addressing soil compaction. Due to the natural slope at the site, any remediation effort had to be careful not to destabilize the existing upper soil profile. The project was done in phases where Areas 1, 2, 3 and 4 were done together as they do not impact the daily flow of foot traffic in the park. Areas 5 and 6 were addressed separately as they are the two largest spaces and have the most foot traffic (Figure 2). The compaction issues were addressed using the following tools/techniques:
Figure 4 Air spade used to aerate and break up soil at Winthrop Square Park.
Air Spading: Useful for tree root collar work and excising of girdling roots. The specialized tool uses compressed air to dislodge, breakup, and aerate compacted soil. Soil amendments are then added and “stirred” into the existing soil using the air tool.
Figure 5 Example of vertical composting.
Vertical Composting: Utilizes air tools to open up holes in the soil along a predetermined grid pattern in turf areas. Soil amendments are then added to these holes and graded over. The compaction layer is slowly broken up by the microbes as the holes begin to coalesce, reducing compaction and improving the overall soil health.
Figure 6 Radial trenching pattern around tree at Winthrop Square.
Radial Trenching: much like the root collar technique, this approach works on a pattern of trenches, radiating from the trunk of the tree, either dug by hand, by machine or by air tool. Soil amendments are then added to help stimulate fibrous roots of the tree.
In addition to the physical decompaction work, incorporating organic matter, both dry and liquid, was critical for maintaining balanced soil biological communities. Dry and liquid soil amendments used in conjunction with the de-compaction work: compost, calcitic lime, bio-char, fish hydrolysate.
Maintenance Recommendations
Potential long term management solutions for the park include top dressing with compost, adding fertilizer, limestone for pH, and fungal foods, grass mowing at 3.5-4” height, and keeping pedestrian foot traffic on walkways. An irrigation system was installed along with moisture sensors to determine proper watering amounts.
Project Progress
The Winthrop Park Project is scheduled for completion in summer 2016, including attention to the hardscape –new concrete, relining the ‘Freedom Trail’, fencing, etc. CASH, with its site-specific soil health analysis and holistic management approach, proved to be effective for soil testing in the urban environment. Using this method, a cherished piece of green-scape for the Charlestown community set an example for how cities can approach future soil health monitoring in city parks.
Authored by: Savanna Crossman, Research Coordinator, CCA
Statistical Analysis by: Margaret Krause, Cornell University PhD Student
*This article is part of an ongoing series. Previous articles can be found at www.nycornsoy.org/research*
Model Validation Underway in NYS
This Precision Ag Research Project debuted its variable rate seeding prescription model on over 500 acres of corn and soybean this spring. The prescriptions were designed to maximize yield using each field’s specific soil, topographical, and historical characteristics. Though this project is focused on using the highest resolution grid management, the data can also be used to guide growers at various levels of precision ag adoption.
Field Level Management
Growers in the Northeast know the challenges of farming the highly varied soils of the region. It is not atypical for one grower to be managing loams, mucks, and gravelly soils across their farm or even across one field. Loamy ground is traditionally treated as the best ground, where growers might try to drive up seeding rates to increase their yields. Other, less productive fields, are usually sown with lower seeding rates as an insurance policy against flooding or other expected hindrances to yield.
Figure 1. The yield of P0216 for Field 8 at the four experimental seeding rates.
The data collected over the past four years of this project are beginning to suggest that this traditional knowledge does not always hold true. For example, Field 8 located in Sackets Harbor, is considered by the grower to be highly productive land. The Pioneer recommended seeding rate for the hybrid P0216 is 30,800 sds/ac in order to reach the typical yield in this field. In 2015, this field yielded the same at 27,000 sds/ac as it did at 42,000sds/ac (Figure 1).
In this field, driving up the seeding rate did not result in driving up yields. If the grower had planted the entire field at 27,000 sds/ac instead of the recommended rate, the grower would have saved $13.30/acre in seed cost or about $1000 in this 75 acre field.
This emphasizes the importance of knowing the productivity of the land and managing each field individually. There are dramatic gains to be made if growers can begin to manage the extreme variations of the landscape instead of the falling back on whole farm averages. Once a grower has become comfortable with this type of management, thinking at a subfield level will yield a further economic advantage.
Grid Level Management
Grid level management is the highest resolution of management being used in the Northeast. This involves using a combination of precision ag technologies such as grid soil sampling, multi-hydraulic drive planters, and RTK GPS.
Figure 2. As-planted data layer displaying elevation acquired via RTK-GPS (field: SW 1). Credit: M. Krause
For this case study, the analysis is focused on a 117 acre field in Union Springs, NY. The field, SW1, exhibits large variations in the topographical landscape with elevations ranging from 512 to 638 feet above sea level and slopes as high as 14.3 degrees (Figure 2). Given these known factors, it is expected that topography will have a significant impact on yield as well as the variation in soil characteristics. To investigate these hypotheses the field was sown with a split planter containing the corn hybrids P0216AM and P0533AM1 in 2015. In the same year, fourteen soil characteristics were measured and geo-located on ½ acre grids across the field.
The hybrid P0533AM1 planted at 27,000 sds/ac resulted in the highest average yield while P0216AM planted at 42,000 sds/ac resulted in the lowest average yield. However, the planting rate was only able to explain 3.1% of the variation in yield here. This serves as strong indication that other factors in the field are contributing to the variation in yield.
As previously mentioned, elevation and slope were expected to have a signification effect on variation in yield. In order of importance, slope, elevation, and curvature exhibited significant correlations with yield and were able to explain 15.5% of yield variation.
The model then added the fourteen soil characteristics to the topographic factors and was able to explain 45.6% of the yield variation. The typical nutrients and soil properties, organic matter, P, K, Ca, and Mg, that are known to support corn growth exhibited significant positive correlations with yield.
Figure 3. Correlations between soil characteristics evaluated via grid soil sampling and topographical characteristics at SW 1.
The strongest relationships indicated that higher levels of magnesium (r=0.54) and pH were found in areas of higher elevation, most likely due to shallower depth to bedrock (Figure 3). The bedrock is more susceptible to weathering and releases nutrients as it broken down by physical disintegration and chemical decomposition. Given the soil type and location, it is likely that the bedrock in this area is limestone dominated by the dolomite mineral (CaCO3 × MgCO3). During the weathering processes, the bedrock releases magnesium and calcium, as well as other minerals, into the soil. Given their stronger charge than other cations, Mg2+ and Ca2+ take the place of other nutrients on negatively charged soil particles. This results in a more basic pH and higher Mg and Ca concentrations on hilltops and side slopes where the depth to bedrock is lower.
Most other soil nutrients were found in lower concentrations in areas of high slope or elevation. This aligns with the general knowledge that soil, and thus soil nutrients, can be easily eroded away from the tops of hills and along steep hillsides. Not surprisingly, phosphorus was the most prone to exhibit a negative relationship with slope. Phosphorus can easily be lost from the soil profile from water runoff or soil erosion. (Figure 3)
High ground and hillsides tended to yield the highest in 2015, which was expected given the above average rainfall throughout the year. It is likely that water was pooling in the low flat areas of the field, negatively impacting root growth and nutrient uptake, thus accounting for lower yields. When compared to a year with dry to average rainfall, it would not be surprising to see these relationships switch.
Figure 4. The distribution of planting rates predicted to be optimal at SW1.
Relationships such as these that are heavily driven by climactic conditions make multiyear testing and historical data of the utmost importance when creating a variable rate seeding prescription. Based on the data available, the model generated a seeding prescription that calls for much lower seeding rates than the grower’s typical practice of 35,000 sds/ac (Figure 4). This prescription is estimated to save the grower approximately $1800 in seed cost without sacrificing yield, however, the 2016 research harvest will test the true performance of the model.
The extreme variability of the Northeast has presented challenges to growers for decades, and finally the research and technology is here to capitalize on this variability. The data analysis has already begun to call into question agronomic theories that were once considered fact. Most notably, the demonstration that the most productive ground can support equally high yields at seeding rates four to five thousand below standard practice. The analysis emphasizes how yield is driven by the interaction between many factors such as elevation, slope, and soil nutrients. SW1 demonstrated how topographic factors can drive yield in field and also how it can influence the spatial distribution of soil nutrients. As the project begins to test these relationships through model validation, it remains critical that the geographic reach of testing locations continues to expand. Any interested parties are encouraged to contact Savanna Crossman at 802-393-0709 or savanna@nycornsoy.com .
Lindsay Fennell1, Shai Sela1, Aaron Ristow1, Bianca Moebius-Clune1, Dan Moebius-Clune1, Bob Schindelbeck1, Harold van Es1, Shannon Gomes2 1Soil and Crop Sciences Section, School of Integrative Plant Science, Cornell University; 2Cedar Basin Crop Consulting
Soil nitrogen is spatially and temporally variable and it can be challenging for farmers to determine a location-specific optimum N rate, often leading to excess (insurance) applications. Corn N management is therefore relatively inefficient, with N recovery (the proportion of applied N taken up by the crop) often being less than 50%. The nitrogen that is lost through leaching and runoff has a massive negative effect on groundwater aquifers and aquatic biota in streams and estuaries downstream. The Chesapeake Bay and Gulf of Mexico are notable concerns and ambitious nutrient reduction goals have been established. Another major concern is the gaseous nitrogen loss that can result in high emissions of nitrous oxide (N2O), a potent greenhouse gas for which agriculture is the main anthropogenic source.
These increased N fluxes into the environment have significant economic and environmental costs. There are a number of approaches to reduce such N losses, including reduced N applications, cover cropping, buffer strips, etc. Arguably the most important one is the better estimation of the optimum N rate so that excess N applications can be avoided.
Adapt-N and Strip Trials
The optimum N rate depends on numerous factors including the timing and amounts of early season precipitation, previous organic and inorganic N applications, soil organic matter, carry-over N from previous cropping seasons, soil texture, rotations, etc. Adapt-N is a simulation tool that combines such location-specific soil, crop and management information with date-specific weather data to estimate optimum N application rates for corn. It thereby allows for precision N management specific to each production environment (field, season, management). The tool was developed at Cornell University and has been licensed for commercial use (adapt-N.com).
The Adapt-N tool also has environmental utility as it simulates leaching losses from the bottom of the root zone and gaseous losses into the atmosphere due to denitrification and ammonia volatilization. Both leaching and gaseous losses are simulated based on soil water dynamics and the use of N loss equations that are modified by temperature and water conditions.
The Adapt-N tool was used in 115 paired field strip trials with two to seven replications conducted mostly on commercial farms (two university research farms were involved) in New York and Iowa during the 2011 through 2014 growing seasons (Fig. 1). Trials were distributed across both states under a wide range of weather conditions, and involved grain and silage corn, with and without manure application, and rotations of corn after corn and corn after soybean. The pre-plant or starter fertilizer rates averaged 76 and 56 lbs/ac for the NY and IA trials, respectively. In each trial, the treatments were defined by the amount of N applied at sidedress, where the rates were:
(i) the Adapt-N recommendation for the date of sidedress, and
(ii) a Grower-selected rate, which typically represented their conventional practice.
We determined corn yields and associated profit differences for the two treatments. In order to directly compare the environmental fluxes resulting from Adapt-N and Grower sidedress N applications, we ran full season simulations (up to December 31st) for all 115 trials and estimated the environmental fluxes that occurred after the application of sidedress N.
Results
Complete results for this study are presented in Sela et al. (in review). We measured clear agronomic benefits from the precision approach of the Adapt-N tool over the Grower treatment: N rates were on average reduced by 40 lbs/ac (34%), while average yields were actually 2 bu/ac higher. This resulted in $26/ac higher profits on average over all 115 strip trials.
For all trials in both states, simulated total N losses (leaching and gaseous combined) were on average reduced by 24.9 lbs/ac (38%) for the Adapt-N recommended rates compared to the Grower-selected rates (Fig 2), in line with the lower applied N rates. Simulated total N losses for the Iowa trials were on average somewhat lower than for the New York trials, presumably due to different climate and soil conditions.
Leaching losses: The average simulated leaching losses of 35.3 and 22.6 lbs/ac (Figs. 2a and 3a) for the Grower and Adapt-N treatments, respectively, are comparable to measured leaching losses from other experiments in the literature. Adapt-N rates resulted in an average reduction of 19.6 lbs/ac (39%) in New York and .3 lbs/ac (3%) in Iowa in simulated leaching losses compared to the Grower rates, and reductions were consistently higher for the New York trials. This can be attributed to several characteristics of the New York sites, including (i) generally wetter climate with much pre- and post-season precipitation, (ii) lower denitrification losses relative to leaching due to generally coarser soil textures, and (iii) shallower rooting depths causing less water and N uptake in the lower soil profile. Simulations were terminated on December 31 of each year, so are underestimates of actual benefits in both states, as further N leaching may still have occurred during spring and winter prior to the next growing season.
Gaseous losses: Simulated gaseous losses (Figs. 2b and 3b) were also lower for the Adapt-N compared to the Grower treatment (average reduction of 12.9 lbs/ac; 39%). The 2011 and 2012 seasons for the New York trials resulted in >50% reductions in simulated gaseous losses when using Adapt-N vs. Grower rates. Again, benefits were generally greater in New York than Iowa, although the relative reduction in gaseous losses in Iowa were greater (18%) than the reduction in leaching losses (3%).
Conclusions
The results of this study show environmental gains from using Adapt-N’s precision management approach to estimating in-season N rates across a robust number of fields, soil types and weather conditions in Iowa and New York. In all, the Adapt-N recommended N rates adapted effectively to the varying field and weather conditions, were generally lower than the Grower’s regular N rate, and achieved both economic and environmental benefits. Although the benefits varied by year, state and site, the overall environmental losses were reduced by 24.9 lbs/ac (more in NY than IA) through the use of this precision management approach. This implies a reduction of 38% in the post-application N losses. In all, use of Adapt-N can significantly contribute to nitrogen reduction goals. A final note: The potential benefits of its use are likely underestimated in this study, especially for IA, as the participants already represented a progressive group of growers who optimize their own N timing and placement decisions with sidedress applications, while many Midwestern growers still apply most of their nitrogen in the fall or at planting.
Acknowledgements
This work was supported by funding from the USDA-NRCS Conservation Innovation Program grant number 69-3A75-10-157, New York Farm Viability Institute, USDA-NIFA WQ grant number 2013-51130-21490, the Northern New York Agricultural Development Program, USDA-Sustainable Agriculture Research and Extension grant number LNE13-328, the International Plant Nutrition Institute, and the McKnight Foundation. We are grateful for the cooperation in field activities from Keith Severson, Sandra Menasha, Anita Deming, and Michael Davis of Cornell Cooperative Extension, David DeGolyer, Dave Shearing and Jason Post of Western NY Crop Management Association, Eric Bever and Mike Contessa at Champlain Valley Agronomics, Eric Young at the Miner Institute, Peg Cook of Cook’s Consulting, and Hal Tucker, Michael McNeil, and Frank Moore of MGT Envirotec. We also are thankful for the cooperation of the many farmers who implemented these trials on their farms.
References
Sogbedji, J.M., H.M. van Es, J.J. Melkonian, and R.R. Schindelbeck. 2006. Evaluation of the PNM Model for Simulating Drain Flow Nitrate-N Concentration Under Manure-Fertilized Maize. Plant Soil 282(1-2): 343–360
S. Sela., H.M. van Es, B.N. Moebius-Clune, R. Marjerison, J.J. Melkonian, D. Moebius-Clune, R. Schindelbeck, and S. Gomes, Adapt-N Recommendations for Maize Nitrogen Management Increase Grower Profits and Reduce Environmental Losses on Northeast and Midwest USA Farms, Submitted to the Soil Science Society of America Journal