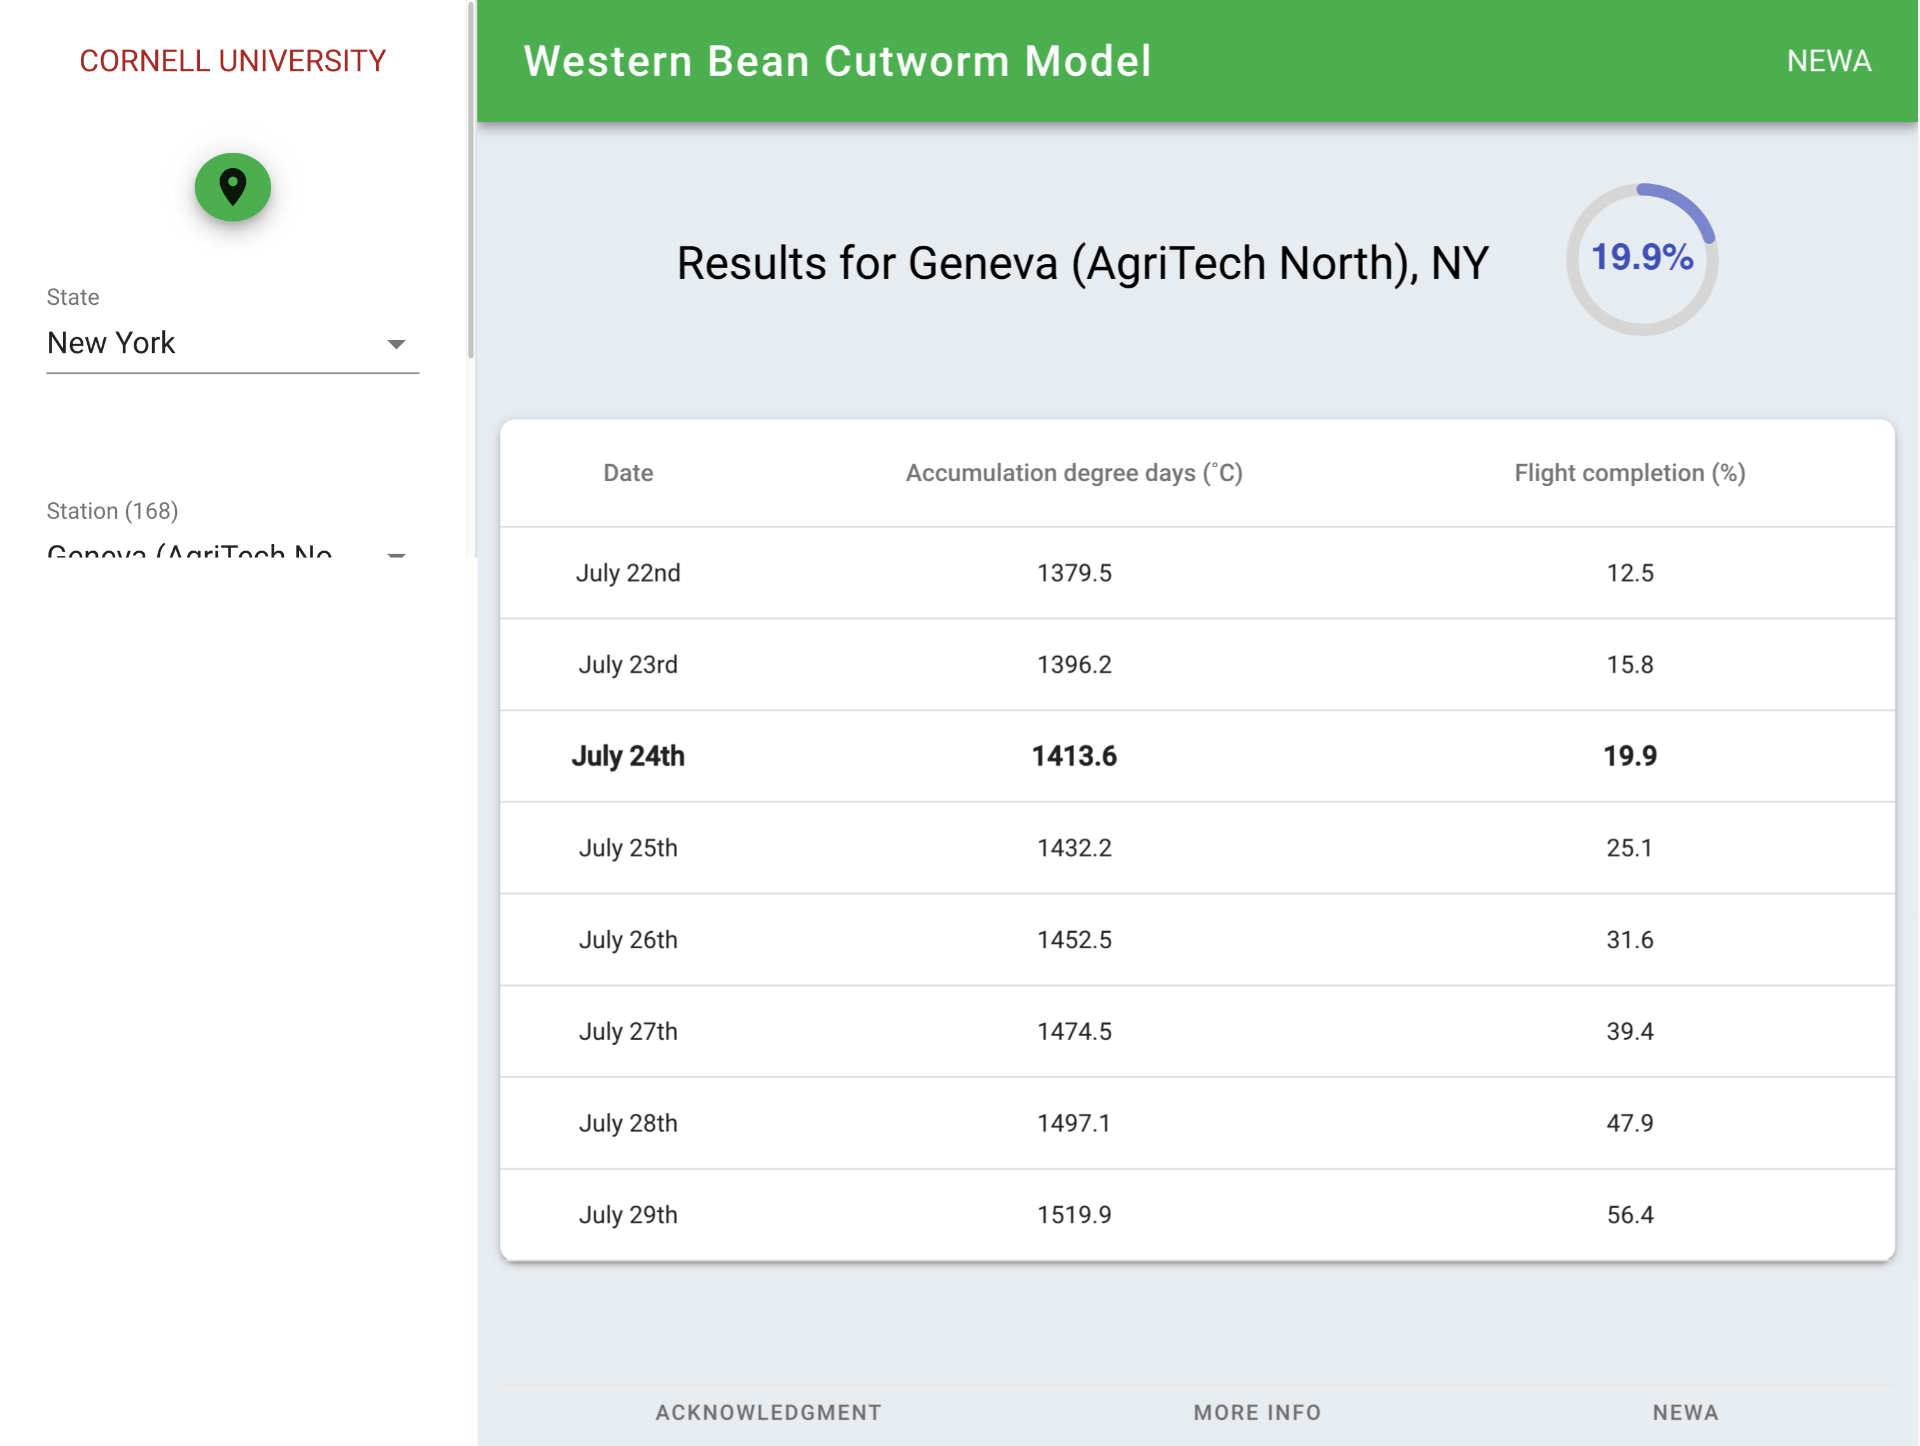
A western bean cutworm flight completion model is available that uses real-time weather data from any NEWA location in NY and beyond. Released in 2018, this model tracks estimates flight completion so growers can precisely time IPM field corn, sweet corn, and dry bean IPM scouting practices. This project was funding in part by a grant from the New York State Vegetable Research Council.
Western bean cutworm (Striacosta albicosta [Smith]) (WBC) was first discovered in New York State in 2009. It has been expanding its range from its origin in the high plains area of the US over the last 20 years. WBC is an insect pest of corn and dry beans, and can cause significant yield and quality losses to field corn grain. In other parts of the Corn Belt, it has become a pest causing significant economic losses in field corn.

Figure 1. The NEWA Western bean cutworm online model uses real-time weather data from 167 grower-owned weather stations located across New York State. NEWA is an open-access platform and does not charge a membership fee. Accessible at http://bit.ly/2G1U99c
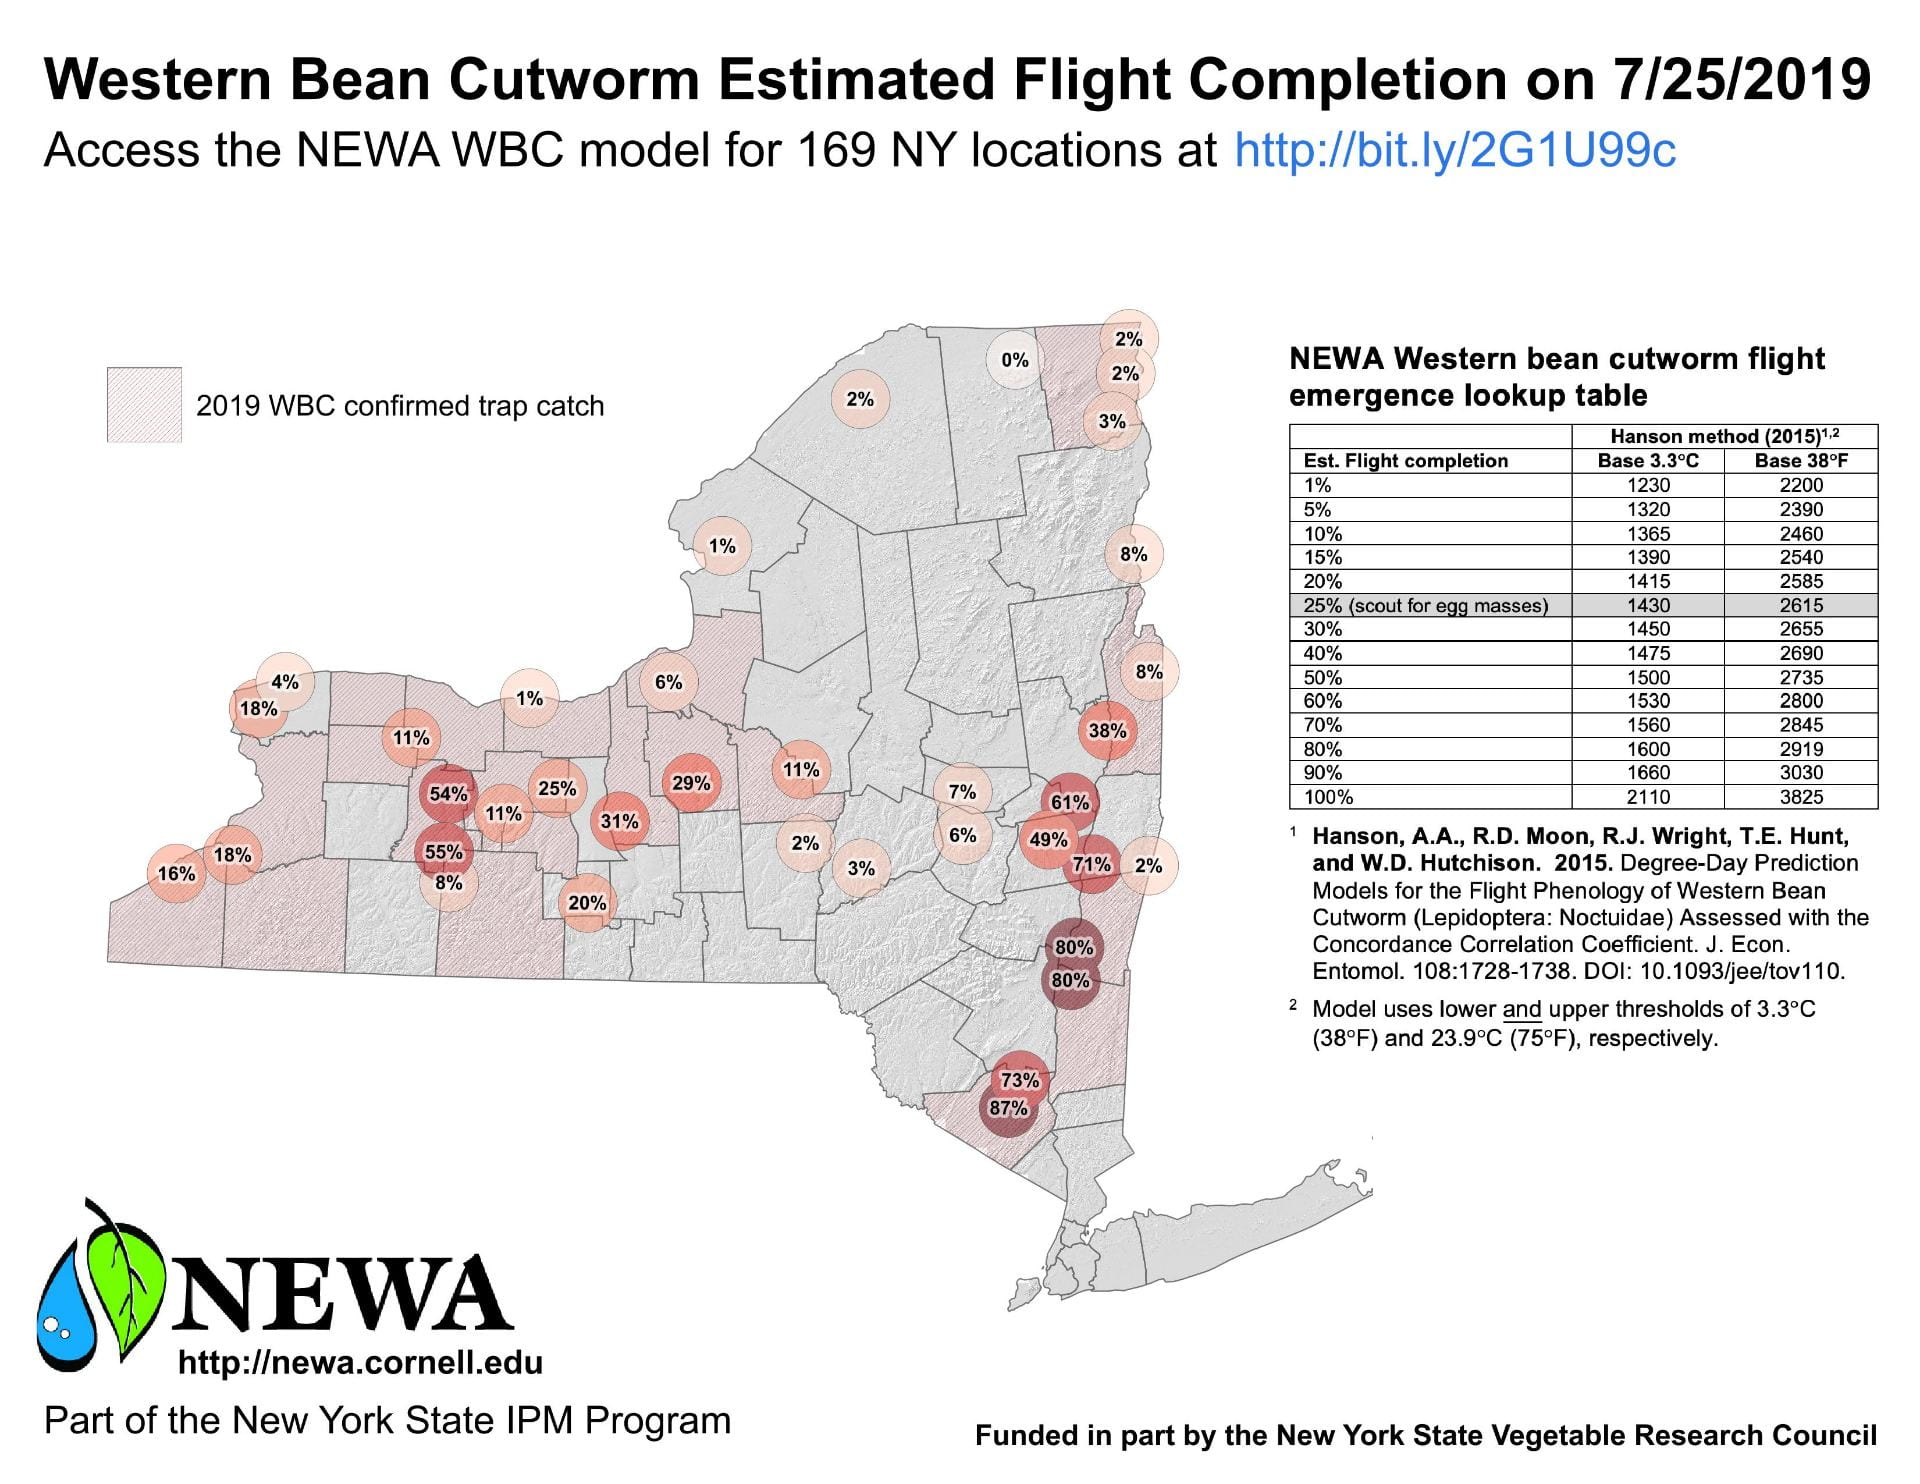
NEWA also generates twice-weekly map updates for New York State using WBC model output from a sub-set of available locations combined with WBC presence/absence data taken from the New York State IPM Program Sweet Corn Pheromone Trap Network Report published weekly throughout the growing season. These maps will be posted to the Your NEWA blog moving forward.

Figure 2. Maps updated twice-weekly during WBC flight emergence periods use the Hanson method2 to estimate flight completion using real-time weather data streamed from 167 physical weather station located across New York State.
Old vs New WBC Prediction Methods
Historical IPM strategies use the ‘Nebraska method’ to estimate 25% WBC flight completion.1 Field scouting is employed to count egg masses when that threshold is reached, and outcomes are then used to justify management actions. The Nebraska method is a simple base 50°F degree day model that was published in 1976.
In 2015, entomologists at University of Minnesota noted WBC range expansion from native areas to the northern and eastern United States. They questioned the Nebraska method’s accuracy for these regions and published a revised flight prediction model called the ‘Hanson method’.2 The Hanson method also uses simple degree day calculations – but uses a different base temperature, adds an upper temperature limit, and begins accumulating earlier in the year (Table 1). 25% emergence is still used as a threshold to begin scouting for egg masses (Table 2).
Table 1. Comparison of old and new model parameters for estimation of WBC flight emergence.
| Method | Nebraska | Hanson |
| Lower threshold | 10°C (50°F) | 3.3°C (38°F) |
| Upper threshold | none | 23.9°C (75°F) |
| Calculation method | Simple | Simple |
| Start | May 1 | March 1 |
Table 2. WBC Estimated flight completion lookup using degree day accumulations based on the Hanson method.
|
Hanson method1 |
||
| Est. Flight completion | Base 3.3°Ca | Base 38°Fa |
| 1% | 1230 | 2200 |
| 5% | 1320 | 2390 |
| 10% | 1365 | 2460 |
| 15% | 1390 | 2540 |
| 20% | 1415 | 2585 |
| 25% (scout for egg masses) | 1430 | 2615 |
| 30% | 1450 | 2655 |
| 40% | 1475 | 2690 |
| 50% | 1500 | 2735 |
| 60% | 1530 | 2800 |
| 70% | 1560 | 2845 |
| 80% | 1600 | 2919 |
| 90% | 1660 | 3030 |
| 100% | 2110 | 3825 |
a The Hanson method uses lower and upper thresholds of 3.3C (38F) and 23.9C (75F), respectively.
References
1 Ahmed, T. R. 1979. Comparison of heat unit accumulation methods for predicting European corn borer and western bean cutworm flights. M.S. thesis, University of Nebraska, Lincoln, NE.
2 Hanson, A. A., R. D. Moon, R. J. Wright, and W. D. Hutchison. 2015. Degree-Day Prediction Models for the Flight Phenology of Western Bean Cutworm (Lepidoptera: Noctuidae) Assessed with the Concordance Correlation Coefficient. J. Econ. Entomol. 108: 1728-1738. DOI: 10.1093/jee/tov110
