NEWA will be featured at the American Phytopathological Society’s Annual Meeting next week, in Pasadena, California. The scientists attending this meeting study plant diseases and many conduct the type of plant disease epidemiology research used to create the IPM tools in NEWA – for apple scab, fire blight, grapevine powdery mildew, potato and tomato late blight, etc.
Carroll will be presenting a poster, titled NEWA: Delivering site-specific applications to farmers—a knowledge network via cloud integration of weather mesonets and proven predictive models authored by J Carroll, D Cooley, T Weigle, P Oudemans, J Clements, D Robinson, T Bradshaw, R Crassweller, K Peter, M Concklin and A DeGaetano.
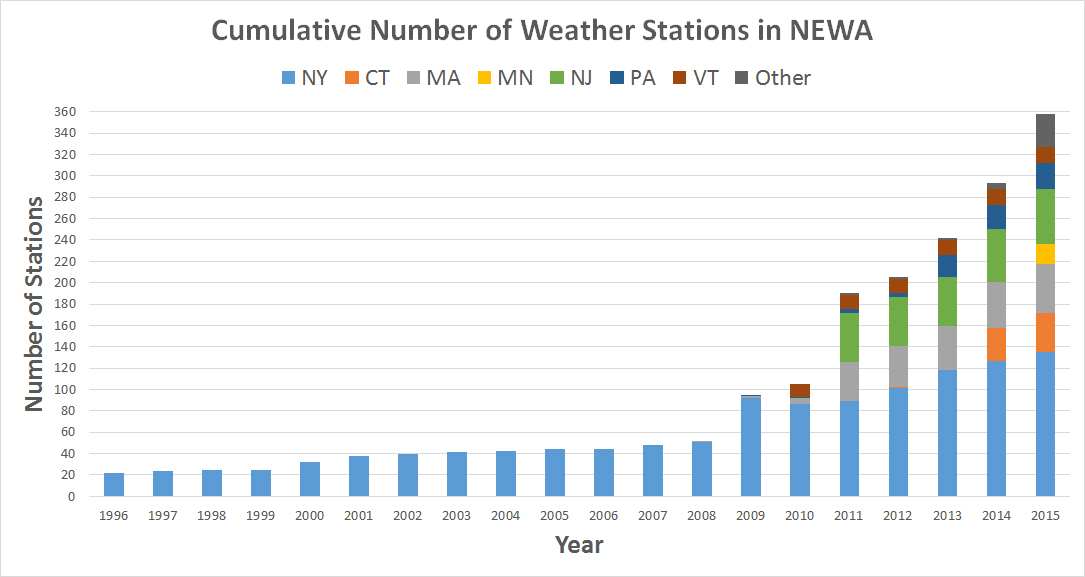
NEWA, The Network for Environment & Weather Applications, transforms weather knowledge into tools for crop production and IPM. Farmers share resources for weather data collection, analysis, distribution, and archiving through integration of networks via cloud computing. Forecasts push results out 5 days using the 5km resolution National Weather Service (NWS) National Digital Forecast Database (NDFD).
For weather data quality control (QC), the Northeast Regional Climate Center (NRCC) monitors each weather station’s data feed, sending alerts to station contacts when no data is received within the last 1, 7, 14 or 21 days and when precipitation is suspect.
Relative humidity (RH) & leaf wetness are woven together for greater coverage for plant disease tools across the NEWA region. Plant disease tools often use leaf wetness sensors—not available from NWS airport weather stations. We compared five models for estimating leaf wetness to leaf wetness sensor measurements. Best estimates have “fraction of correct estimates” closest to one; “correct success index” closest to one; “false alarm ratio” closest to zero. A “bias” measure < 1 is an underestimate and > 1 is an overestimate. Highlighted dark blue are the best estimate scores, in brown the worst. The CART, Dew Point Depression, and Extended RH Threshold models consistently overestimated leaf wetness. The Fuzzy Logic performed satisfactorily for this group of stations, but generally underestimated leaf wetness, possibly due to assumptions made regarding the handling of net radiation and wind speed during the overnight hours. The Fuzzy Logic model obtained high Correct Estimate scores because it does a good job of predicting “Correct Negative” events. The RH ≥ 90% model gave the best estimate scores for all the comparison indices and was implemented in NEWA tools in 2012.
In addition, NEWA adjusts the airport weather station relative humidity (RH) values for agricultural applications. The NWS RH forecast values are also adjusted in the same way for all locations. The formula used for these adjustments is: adjusted RH = RH / (0.0047*RH + 0.53). For most of the range, they are very similar. A graph and description is here: http://newa.nrcc.cornell.edu/dew_notes.htm. If a simulation model for a particular application (e.g. the late blight tool, Simcast) uses a specific algorithm for RH, NEWA adopts that for running related IPM tools for consistency.
NEWA has positive impact on farm practices! NEWA’s impact was evaluated in 2007 by The Survey Research Institute (SRI), Cornell University. NEWA users reported that they can save, on average, $19,500 per year in spray costs and prevent, on average, $264,000 per year in crop loss as a direct result of using NEWA pest forecast models. NEWA users primarily seek both weather and pest forecast information. 99.2% of NEWA end users would recommend NEWA to farmers. Just a “Heads up!” – we’ll be surveying our end-users again to learn how we are doing and how we can improve.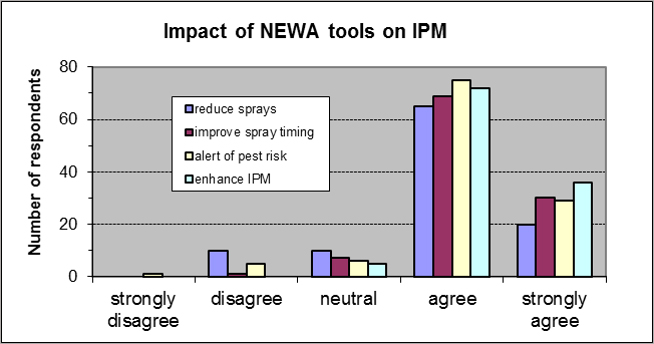 Reactions of survey respondents to four statements:
- NEWA pest forecast information helps me reduce the number of sprays I apply to control diseases, insects, mites, or weeds.
- NEWA pest forecast information improves the timing of my spray applications.
- NEWA pest forecast information alerts me to the risk of pest damage.
- NEWA pest forecast information enhances IPM decision-making for my crops.
Everyone agreed that NEWA enhances IPM decision-making for their crops. The only statement to which one respondent strongly disagreed was that NEWA pest forecasts alert me to the risk of pest damage: most likely because pest developmental models in 2007 only alerted to infection events that already occurred in the previous 12 to 24 hours. Today, NWS forecasts truly push risk alerts. Ten people disagreed with the statement that NEWA helps reduce the number of sprays, more than for any other statement: likely because during wet years pest models may call for more sprays to keep some fungal diseases under control.
Web stats: NEWA enjoyed 722,145 page views and visits per year, January to December 2014. NEWA monthly usage statistics for the period January 1, 2014 to December 22, 2014 are shown in the charts below: at top are the statistics for the forecast tools via NRCC (blue bars) and for the NEWA website (red bars) and at bottom are the usage statistics from WebStats for the NEWA website.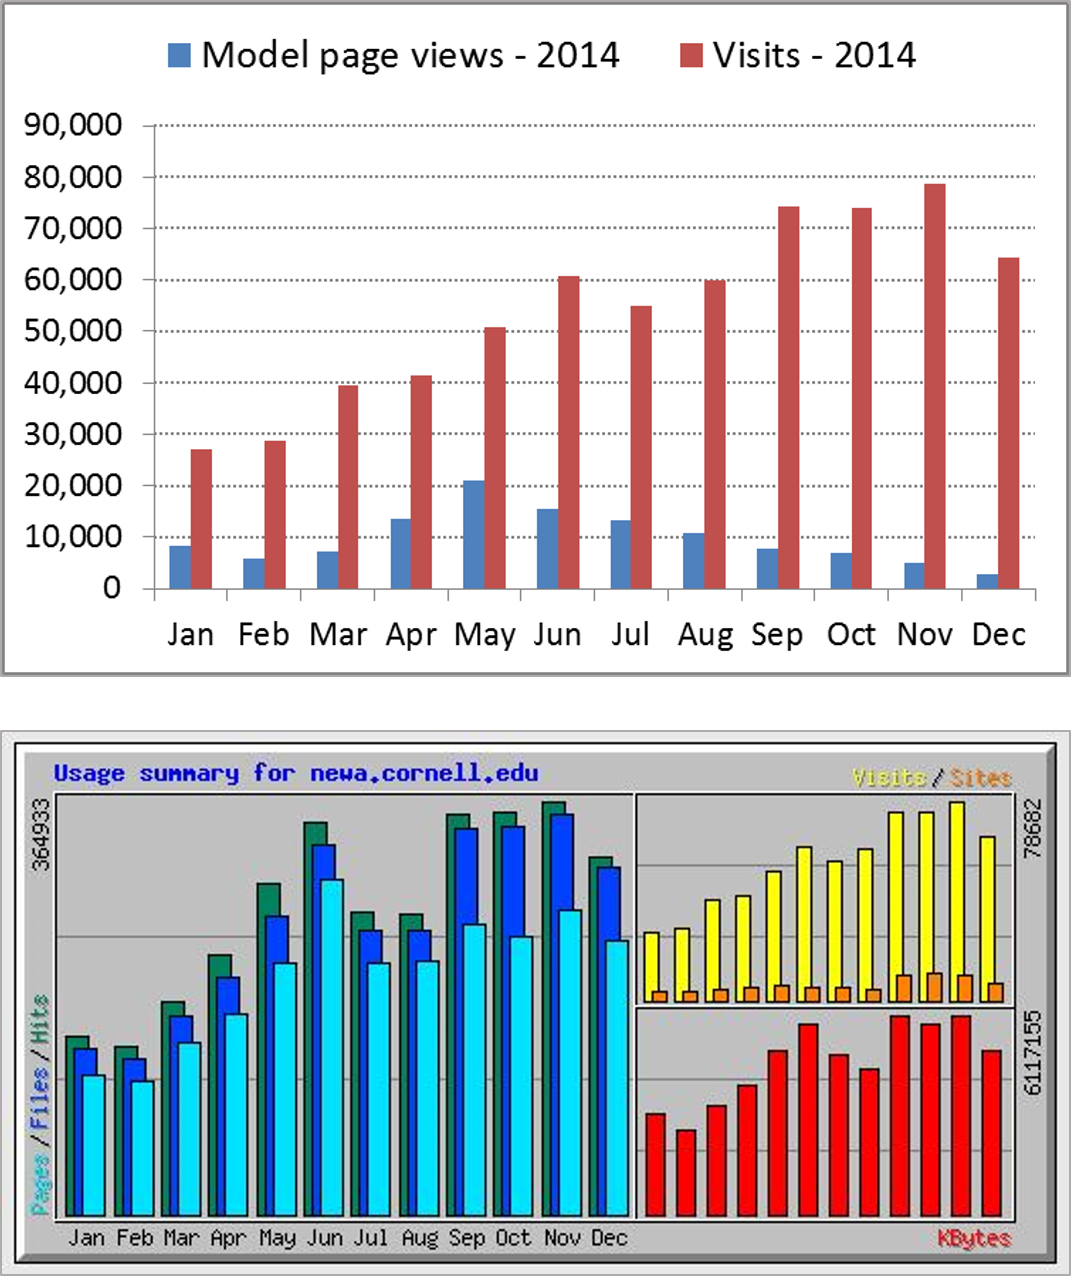
Sharing information about NEWA with other scientists, will help us partner with other states’ weather networks so NEWA can continue to grow and to improve its delivery of user-friendly, weather-based tools to support agriculture.