A cautionary note from developer, Dr. Alan Lakso, “With the frost and winter damage that has been reported recently, I thought I should mention concerns about using the NEWA apple carbohydrate thinning model. The model assumes a healthy tree with good water relations, nutrition and normal function, so it doesn’t try to account for stresses like frost. Such stresses will change the carbon supply if the leaves are hurt and would affect the demand if the number of fruit are reduced. The apple carbohydrate thinning model still will give an idea if there are major carbon deficits, in addition to any frost problems.”
Apple growers must keep this in mind and not depend exclusively on the model under these conditions, as carbon balance may not be the limiting factor on crop load in trees under stress. What stresses trees out? freeze damage, drought, flooding, extreme heat, plus the usual pest suspects. Horticulture Specialist Mario Miranda Sazo brought to our attention a simple procedure developed by Dr. Jim Schupp, Penn State, for doing bud damage assessments that might be helpful to you: http://extension.psu.edu/plants/tree-fruit/news/2016/assessing-fruit-bud-survival-and-crop-potential
About the Cornell Apple Carbohydrate Thinning Model, from Dr. Rob Crassweller, Penn State.
“As a refresher, the Cornell apple carbohydrate thinning model was developed by Alan Lakso at Cornell University and adapted for practical use by Terence Robinson at Cornell University. The model, using fundamental tree physiology, estimates over a season (from bud break) the carbohydrate production by an apple tree (with a set description) and the total demands for growth from the crop and the tree. It calculates a balance of supply to demand each day as the season progresses, using the weather data that is entered from the chosen weather station.
“It should be noted that the model does not attempt to model any specific variety or training system. The general carbohydrate balance it calculates has been found to correlate well with tree sensitivity to natural drop and with sensitivity to chemical fruit thinners. Cool sunny periods of good carbohydrate supply leads to reduced natural drop and less response to thinners. Cloudy hot periods result in carbohydrate deficits and lead to stronger natural drop and stronger response to thinners. The four-day running average is used since studies and observations have shown that the apple tree does not respond to just one or two days of good or bad weather but rather has a capacity to respond more slowly to changes in weather.
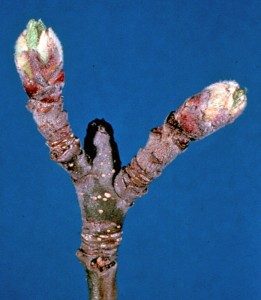
Green tip growth stage on apple.
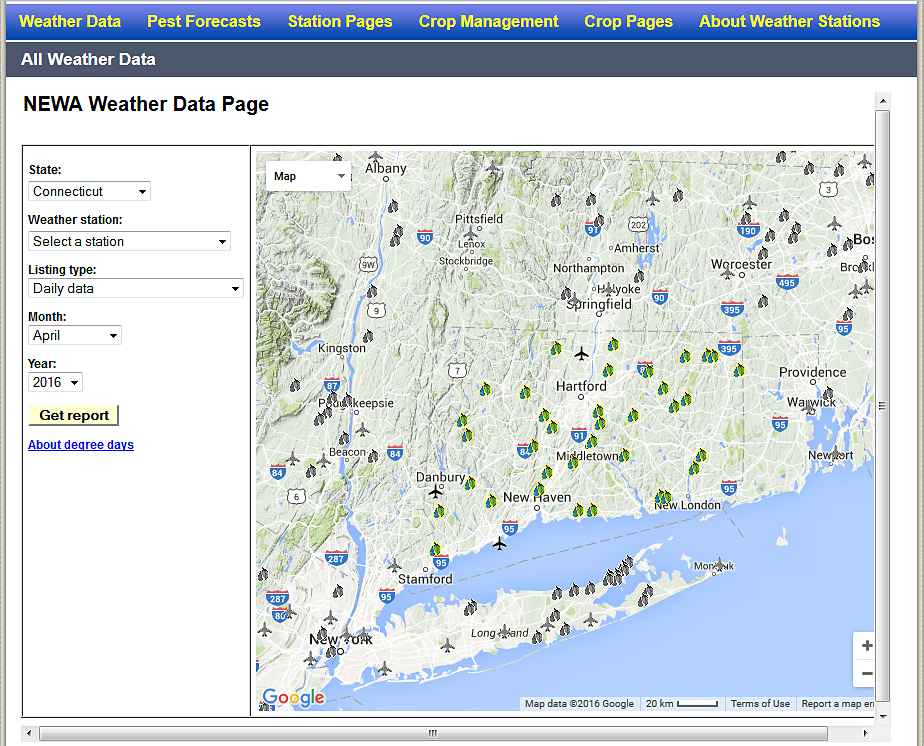
“To utilize the carbohydrate model go to NEWA and then highlight the “Crop Management” tab in the blue banner and highlight “Apple Carbohydrate Thinning”. To choose a station site, maneuver the map below and click on the weather station closest to you; then click on the “Continue” button in the left hand box. Keep a record of your apple varieties’ green tip and bloom dates. You will need to enter these each time you use the model. In the box for “Green tip date” and in the box for “Bloom date” enter the dates when the apple variety of interest reached that growth stage; click the green button “Calculate” and the model will automatically calculate the carbohydrate production, use and remaining balance.
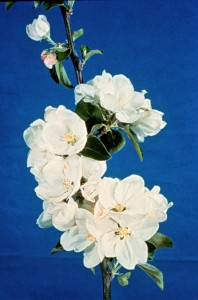
Full bloom growth stage on apple.
“Thinning recommendations will not be presented until after you reach full bloom. (You can run the model before bloom has occurred to determine the estimated tree carbohydrate balance based on weather conditions, with all other conditions, water relations, nutrition and tissue function, assumed to be normal.)
“In most years green tip and full bloom do not vary much by cultivar, but in case it does this year, you can run the model changing the green tip and full bloom date to get the most accurate picture of carbohydrate status. To maximize the evaluation of the model it is best to choose specific cultivars and input the appropriate dates. Record your thinning applications and then return in late June to evaluate the effectiveness of your thinning treatments.”
Reminders!
A NEWA website upgrade will be done Tuesday April 12, 2016 at 1:00 PM, there may be up to an hour downtime so plan accordingly.
When using NEWA tools, keep a record of growth stage and trap catch dates and enter them each time you use the tools. More info is in NEWA Default Biofix Dates.
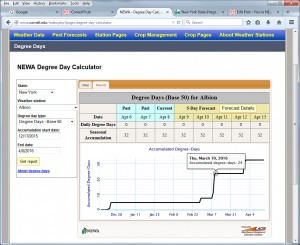
Try out the new Degree Day Calculator on NEWA.