Thank you to all who participated in the drought survey last year. Here are the findings from the survey, written by Shannan Sweet and David Wolfe, School of Integrative Plant Science, Cornell University.
Key Findings
- The record-breaking 2016 drought affected farmers across New York State (NYS) with more severe effects in Western and Central NY than Eastern NY.
- Crop loss estimates from a late summer survey of over 200 farmers suggest that more than 70% of rainfed field crop and pasture acreage had losses greater than 30%, with some reporting over 90% crop failure.
- Most fruit and vegetable growers who irrigate lacked the irrigation capacity and water supplies to keep up with the drought, and estimated crop losses of up to 35% were reported.
- Common suggestions from farmers on help they could use in dealing with future drought included better long-range weather forecasts, financial assistance to expand irrigation capacity, and more information on drought resistant crops.
Background
An unusually low winter snow pack, followed by lower than average rainfall and higher than average temperatures during the 2016 growing season (NRCC) led to continuously worsening drought conditions throughout New York State, and record-breaking low stream flows in Western and Central NY by late July and August (Drought Monitor). New York (NY) farmers have asked if they should expect more dry summers like the one we had in 2016 in the future with climate change. The answer to that is we don’t entirely know. Climate scientists are fairly certain that the number of frost-free days will continue to increase and summers will be getting warmer, which will increase crop water demand (Horton et al. 2011; Walsh et al. 2014).
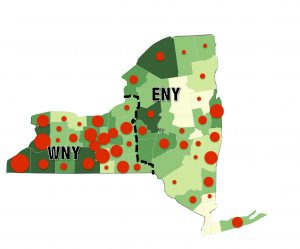
Figure 1. Drought survey responses by county. Darker green colors indicate a greater number of farms (Source: 2012 USDA NASS, ESRI – 12-M249). Red dots designate counties that responded; larger dots indicate a greater number of respondents. The dotted line delineates Western (WNY) and Eastern (ENY) New York. Counties in WNY were those designated as “national disaster areas” due to the drought.
Climate models are less reliable for predicting rainfall and snow, but most projections suggest that total annual precipitation will remain relatively stable in New York, with small decreases in summer months and possible increases in winter. Also, the recent trend of the rainfall we do get coming in heavy rainfall events (e.g. more than 2 inches in 48 hours) is likely to continue. This would suggest both flooding and drought will continue to challenge New York farmers, and it is possible that more severe short-term droughts in summer could increase in frequency. Given these projected impacts, we surveyed NY farmers throughout August and September, so as to better understand how farmers were affected by the 2016 drought and if they are able to cope with drought risk. The survey was distributed online and in paper format with the help of Cornell Cooperative Extension and the Farm Bureau, and 227 farmers responded from nearly every county (Fig. 1). Though a majority of responses came from field crop farmers, vegetable and fruit crop farmers were also well represented (Table 1).
Drought Impact
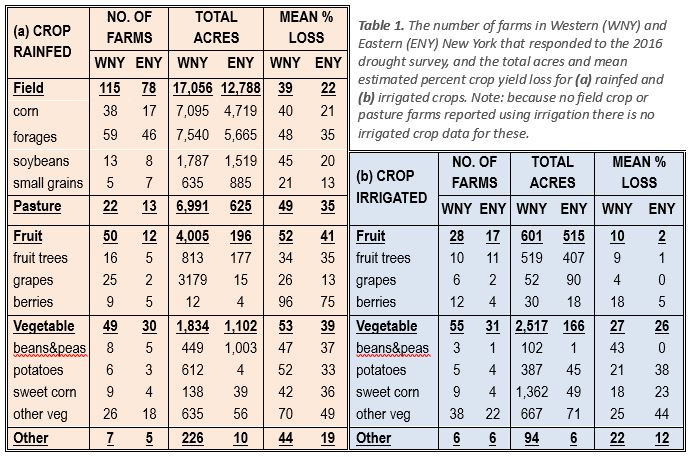
Across the state, farmer-estimated crop losses for rainfed field crops, pasture, fruit crops and vegetable crops were 31%, 42%, 47%, and 46%, respectively (Table 1). Among fruit crops, rainfed grapes, known for relatively deep root systems, were markedly less affected by the drought than fruit trees (primarily apples) and berries (Table 1).
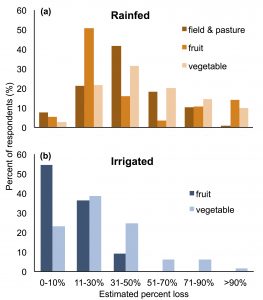
Figure 2. Percent of respondents that estimated crop yield losses within certain percent ranges for (a) rainfed and (b) irrigated crops. Data averaged across New York State.
Figure 2 illustrates that estimated crop losses of more than 30% were reported for rainfed field, pasture and vegetable crops, and some farmers reported losses above 90%. Significant crop losses were reported even for the irrigated acreage of fruit and vegetable crops (averaging 6% and 27%, respectively, Table 1). This reflects an inability to keep up with crop water demand on irrigated acres in 2016 in this severe and long-term drought. When asked what most limited their ability to maintain yields, 38% said limited water supply, 31% said inadequate irrigation equipment, and 18% said poor soil water holding capacity (data not shown). Other reported factors that most limited their ability to maintain yields, included: lack of time, labor costs, water costs, the need to rotate irrigation equipment through crops, excessively hot temperatures, damaged and malfunctioning equipment, and being unprepared in every way for needing to irrigate.
Additional comments from farmers related to the effect of the drought included statements about: extra costs associated with buying hay; having to sell cattle due to an inability to keep them watered and fed; and concern about the effect of the drought on next year’s crops (e.g. perennial fruit crops). Several farmers indicated factors that helped them get through the drought, including: cover cropping, no-till farming, increased soil health, and improved grazing management.
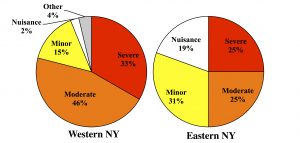
Figure 3. Western and Eastern NY (see Fig. 1) farmer’s rating of the economic impact of the drought.
The drought impact was so severe in Western NY (WNY) that the USDA-Farm Service Agency (FSA) declared most counties in this region “natural disaster areas” in 2016, and eligible for some financial relief in the form of low-cost loans (FSA). The more severely drought stricken farms in WNY reported higher crop loss for both rainfed and irrigated crops compared to Eastern NY (ENY) (Table 1). In WNY nearly 80% of farmers estimated the overall economic impact “moderate’’ to “severe”, and less than 20% considered it “minor” or just a “nuisance” with almost no economic impact. Many farmers in ENY also felt a substantial economic blow, but only about half categorized the impacts as “moderate” to “severe”, and the other half referred to it as “minor” or a “nuisance” (Fig. 3).
Adaptive Capacity
The majority of fruit farmers who irrigated reported using drip irrigation (data not shown). Most vegetable crop farmers who irrigated used moveable sprinkler pipes and big gun sprinklers. In this extreme year, several farmers who lacked irrigation equipment reported using anything from hoses and hand watering to sprayers and garden sprinklers. Sixty-five percent of farmers reported using well and pond water for irrigation, 15% used city water, and 14% used streams, lakes, or canals. Other water sources used for irrigation included hydrants, cisterns and springs. Most farmers said ponds (45%), wells (24%), and streams (22%) proved to be inadequate sources of water this year. The 6% who claimed that city water was inadequate said it was the cost that was prohibitive.
When asked what criteria farmers used to prioritize which fields to irrigate 34% said crop value, 29% said crop sensitivity to stress, 21% said location to water source, and 8% said soil water holding capacity. Other factors used to prioritize where to irrigate included: which crops had a better chance of survival (e.g. mulched or weed fabric covered crops, crops in hoop houses or high tunnels), the maximum amount they could irrigate, the ease of irrigation (e.g. planting in plasticulture), the amount of water remaining in their irrigation source (i.e. how low was the pond), age of perennial crops, or soil moisture sensor readings. When asked what criteria farmers used to prioritize when to irrigate 38% said crop sensitivity to stress, 25% said weather forecast, 22% said crop value, and 11% said soil water holding capacity. Other criteria used to decide when to irrigate included soil moisture sensors and online tools (e.g. CSF water deficit calculator).
Farmers’ responses varied when asked what they might have done differently if they had known in advance how dry this summer would be (Fig. 4). A common response (22%) was
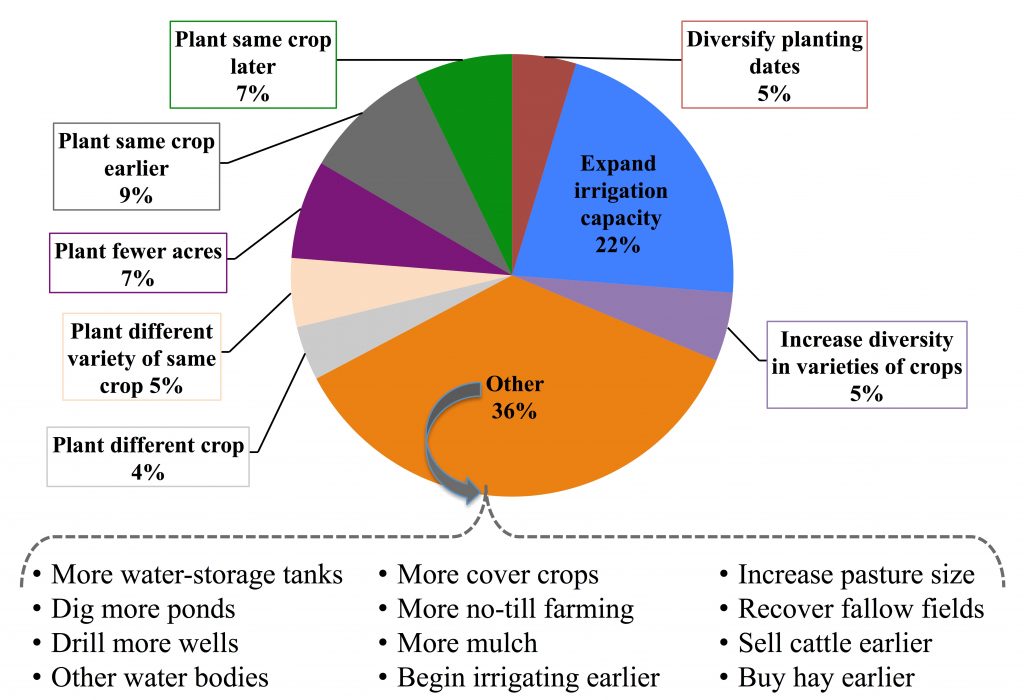
Figure 4. Production change farmers would have made if the drought could have been anticipated.
expand irrigation capacity, but many (36%) selected the “other” category and wrote in options that included suggestions related to increasing water availability (e.g. more ponds or wells), building soil organic matter and water holding capacity (e.g. cover crops and no-till), and many others.
Insights for Extension Educators, Researchers and Policy Makers
When asked how organizations such as Cornell Cooperative Extension, university researchers or government and non-government agencies could help them cope with future drought risk, farmers expressed interest in knowing more about:
- Drought resistant crop varieties
- Irrigation development and planning, irrigation options for perennial fruit crops, and gravity-fed irrigation
- Improving soil quality and water retention, and water saving ideas
- When and how to irrigate specific crops, and how soil moisture affects nutrient uptake
- Pasture rotation, silvopasture, rotational grazing, and stockpiling forage
- How to minimize the effect of drought (e.g. weed control and mulching)
- What pests are more (or less) prevalent during a drought
- Dealing with mental stress related to drought and climate issues
In response to that same question, farmers said they wanted more:
- Development of online tools and better long-range forecasting
- On-farm courses and training, and educational materials about agriculture and drought
- Financial assistance to cover drought losses
- Inventory of vacant farmlands for potential use
- Financial assistance for irrigation equipment and ponds, and for soil improvement and water management
- Rentable and leasable irrigation equipment, and cheaper county water for agricultural use
- Cost sharing for: cover crops and no-till supplies, and for multi-purpose ponds
References and Hyperlinks
CSF (Climate Smart Farming) – www.climatesmartfarming.org
CSF water deficit calculator – http://climatesmartfarming.org/tools/csf-water-deficit-calculator/
Drought Monitor – http://droughtmonitor.unl.edu/
Drought Survey – https://dl.dropboxusercontent.com/u/27816/Survey_Drought_8-5-16%20(mail-in).pdf
FSA (Farm Service Agency) – http://www.fsa.usda.gov/news-room/emergency-designations/2016/ed_2016_0825_rel_0095
Horton R, Bader D, Tryhorn L et al. (2011). Ch. 1: Climate Risks. In: Responding to Climate Change in New York State: The ClimAID Integrated Assessment for Effective Climate Change Adaptation. New York Academy of Sciences. pp 217-254.
NEWA apple irrigation tool, Cornell Apple ET Model – http://newa.cornell.edu/index.php?page=apple-irrigation
NRCC (Northeast Regional Climate Center) – http://www.nrcc.cornell.edu/regional/drought/drought.html
USDA (United States Department of Agriculture) – https://www.agcensus.usda.gov/Publications/2012/Online_Resources/Ag_Census_Web_Maps/
Walsh J, Wuebbles D, Hayhoe et al. (2014): Ch. 2: Our Changing Climate. In: Climate Change Impacts in the United States: The Third National Climate Assessment. U.S. Global Change Research Program, 19-67.
This project was funded by Cornell University’s Atkinson Center for a Sustainable Future and The Nature Conservancy and done in collaboration with the Cornell Institute for Climate Smart Solutions (CICSS) For more information contact Shannan Sweet: 126 Plant Science Bldg., Ithaca, NY 14853; 607 255 8641, sks289@cornell.edu.