 To find out if NEWA isn’t getting your weather data look at the Hourly Data page in NEWA to find gaps or brown italicized font—these indicate missing or estimated data. Hourly Data variables can also show you daily weather patterns, extremes in temperature and rainfall that are beneficial to maintaining your crops, but also maintaining your weather station. This time of year is an excellent time to maintain your weather station. Take a look at the station, clean the rain gauge, and if the station has been in service for more than two years, it’s time for a calibration at Rainwise. If you’ve had any data transmission issues during the growing season, now is the time to do some troubleshooting, too, before the weather turns bitter cold.
There are several ways to access the Hourly Data page from NEWA’s main menu. The two easiest ways are through Hourly Data or your Station Page. Hourly Data is in the drop down list under Weather Data, the first main menu item on the left. Station Pages are in the middle of the main menu or you can get to them by clicking on the map icon. Also, under Weather Data, if you choose All Weather Data from the drop down list, you can browse the list of all the weather data tables available in NEWA, including Hourly Data. You can look at any Hourly Data available, the earliest being 1996, depending on what date the weather station was installed, but for maintenance and troubleshooting, the current and most recent months are of greatest value.
The most direct way to get NEWA Hourly Data is from “Hourly Data” under the blue main menu heading entitled Weather Data. Hovering your cursor over or tapping this will open a list of potential choices; click or tap on the drop down choice Hourly Data. This redirects to the NEWA Hourly Weather Data page displaying drop down boxes and a table of monthly data links. Either select a station, month, and year using the drop down boxes and hit “Get report” or click on a month provided in the table (blue links; purple links are previously viewed). By using the drop down boxes you can choose any year that is available for that station, while the months provided in the main chart are for the current year. Currently, the NEWA weather stations in the table don’t include the airport locations and are grouped according to state (the first listed are for NY; scroll down to find other states). We’re upgrading to add a drop down choice for state, which will group the weather stations by the state you choose. Look for this upgrade in 2016! Once you make the selection, the page of results will display in an “Hourly Data Summary” for that month.

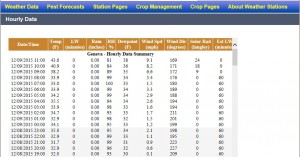
The NEWA Hourly Data Summary table page provides hourly data in monthly tables for the weather station location and date chosen, in this case Geneva, NY. You can copy and paste data into Excel for further use.
Only functioning weather stations are included in the drop down lists. If you can’t find the station you are looking for, chances are it is currently inactive. A list of inactive weather stations is provided in the “Select station” drop down box. Any weather stations inactive for more than 3 weeks are taken out of NEWA and listed at the bottom of the drop down list.
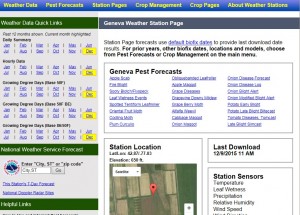
Quick access to your Hourly Data Summary pages from your Station Page. Click or tap directly on Station Pages in the blue main menu. This displays the NEWA map with a scroll down box on the left listing every functioning weather station in alphabetical order. You can click or tap either on the weather station name in the scroll down box or on the NEWA map icon (raindrop/leaf logo or airplane symbol). Hovering your mouse over the map icon will display a pop-up with the name of that specific station.
Once you select a station, the Station Page will display. From here there are a number of tools to use, but we’ll focus on Hourly Data. Under the top green banner, Weather Data Quick Links, look for Hourly Data. This displays each month in a yearly cycle, with the current month highlighted in yellow. Select the month you want and the Hourly Data Summary for the station you are on (in this case Geneva) will display, as shown above, accessed on December 9, 2015.
All Weather Data, a comprehensive way to view the weather data for your station of interest, is found in the drop down list under “Weather Data” on the blue main menu. All Weather Data redirects to a page displaying a map with four drop down boxes to the left. From here you are able to select a weather station location from the drop down list or the map icon, the “Listing type”, and the month and year that you want to find weather data for. Select Hourly data as your Listing type and click on “Get report” to display the Hourly Data Summary page you’ve selected. The example shown above is for Geneva, NY.
Each of these ways to get the Hourly Data Summary pages displays in a monthly table essentially the exact same hourly data you’ve queried. Knowing how you got there is easy—look at the gray banner headings on the Hourly Data Summary pages. The table with heading Hourly Data is from the Hourly Data page, Geneva (or a station location name) is from the Station Page, and All Weather Data is from the All Weather Data page. The Hourly Data Summary table has columns for each collected variable. The variables are the sensors on and data collected by the weather station, and include: the date and time (mm/dd/yyyy 24-hr time), temperature (°F), LW (leaf wetness minutes), rain (inches), RH (percent relative humidity), dewpoint (°F), wind speed (mph), wind direction (degrees), solar radiation (Langley), and estimated LW (leaf wetness in minutes).
Under certain circumstances data is missing. This is how you can tell whether or not NEWA is receiving weather data from your station. Missing data that has been patched shows up as brown italicized font. Whenever data is estimated or patched (brown italicized) a detailed description of how these estimates are made is provided in a pop-up window linked below the Hourly Summary table. Italicized data may indicate a problem in data transmission or function of the weather station battery or sensors. If you see this in your Hourly data, reference the Troubleshooting Guide under “About Weather Stations” or contact Tech Support. Another way to see if NEWA is getting your weather data is by looking directly at the individual variables. Does it show rain data when it has not actually rained? Or the opposite, is there no rain data being shown when it is actually raining? Or are you seeing temperature data or relative humidity data that is so bizarre that something must be wrong? Looking directly at the data allows you to see just how well your weather station is performing.
Make it a New Year’s Resolution to check Hourly Data! Get to know typical weather patterns and learn how to maintain and troubleshoot your weather station to keep it functioning within normal specifications.
Written by Nicole Mattoon and Juliet Carroll, NYS IPM Program
