We have incorporated National Weather Service forecasts into the apple scab tool and also into the grape diseases tools on NEWA! Some confusion arose early this week because of the way a combined wetting event was being displayed in the apple scab Infection Events Summary, but we have fixed that and added some explanations to the page to help you look into the 5-day future forecast for disease risk. As always, we welcome feedback at newa@cornell.edu. Now these IPM tools show the two past days, the current day, and 5 days in the forecast.
Apple Scab
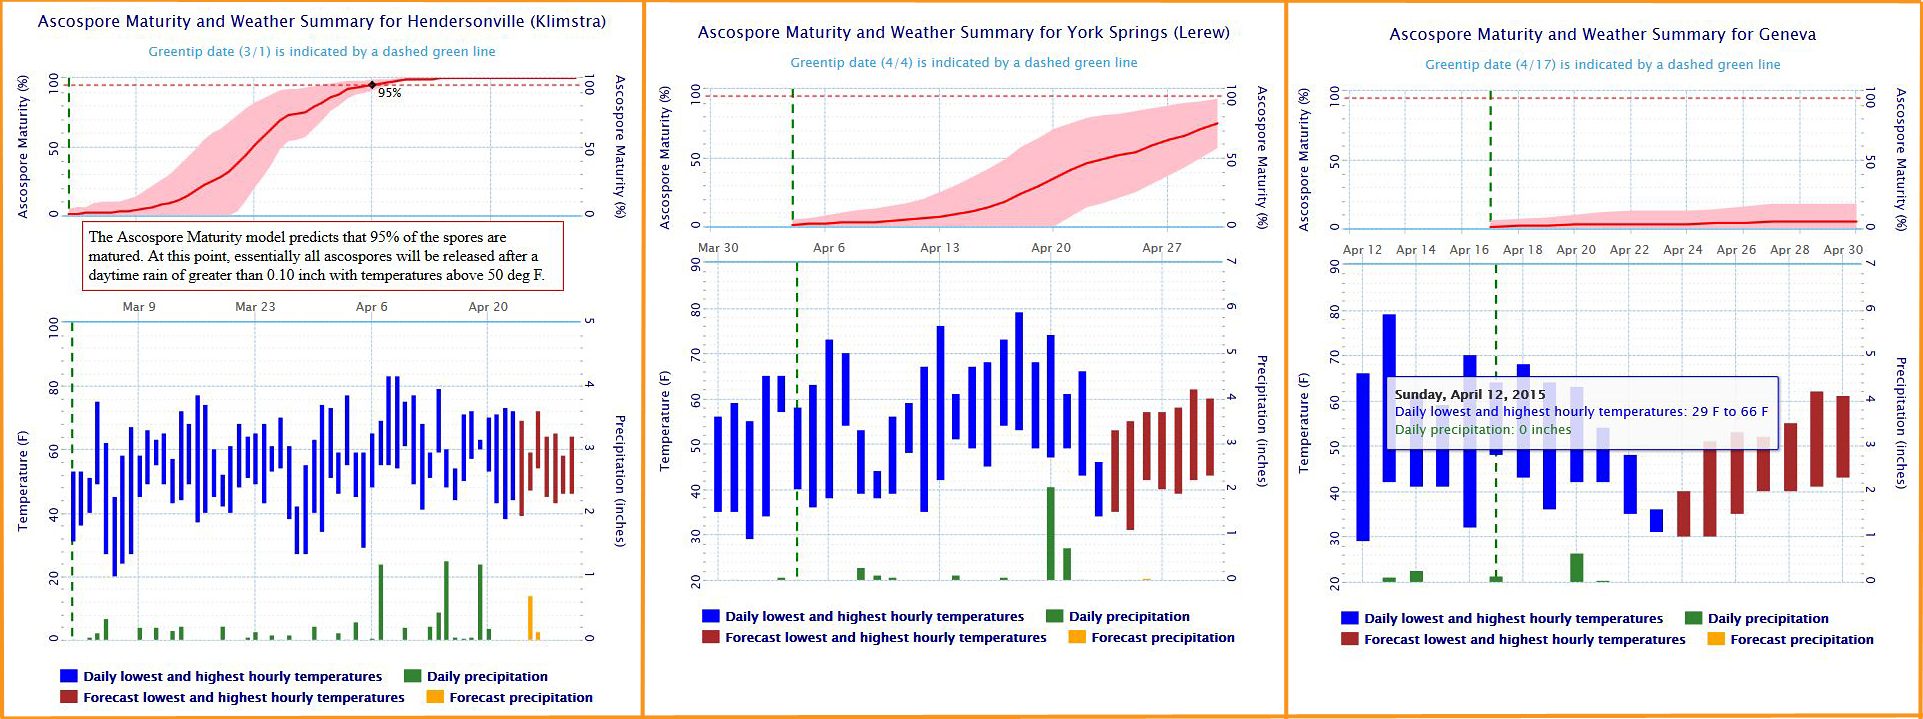
The apple scab tool calculates the maturity of ascospores overwintering in leaf litter. The Ascospore Maturity degree day model begins at 50% green tip on McIntosh flower buds and provides an estimate of the potential for ascospore discharge in the next rain. To recalculate ascospore maturity for your specific orchard situation, you can enter your green tip date. Keep it always handy for the next time you use the apple scab tool, because NEWA doesn’t remember this for you. The ascospore maturity graph, accessed from the Ascospore Maturity Graph button, gives a snapshot of the primary scab season for your location; compare our most southerly location in Hendersonville, NC, to York Springs, PA, to Geneva, NY in the graphs below.

Ascospore maturity in Hendersonville, NC, York Springs, PA, and Geneva, NY. Mouse over to get details on the date, as shown for Geneva.
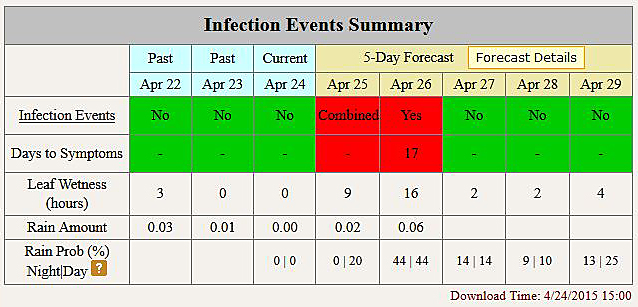
Apple scab infection events, shown in red in the Infection Events Summary, are calculated beginning with 0.01 inch of rain. The word “Combined” in the above table means the wetting event on this day is being combined with another wetting event. To calculate the length of a wetting period, we use the following rule: two successive wetting periods, the first started by rain, should be considered a single, uninterrupted wet period if the intervening dry period is less than 24 hours. When an infection event is in the 5-day forecast, the actual weather data logged may or may not translate into an actual infection event. Therefore, the table output may change once actual weather data is logged.
Always check the download date and time, because the Current date in the Infection Events Summary has data that is made up of actual data and forecast data, so the infection event on this date may change, depending on the accuracy of the forecast.
