Margaret Ball1, Bianca Moebius-Clune2, Shannon Gomes3, Aaron Ristow1, Harold van Es1,Soil and Crop Sciences, Cornell University1, NRCS Soil Health Division2, Cedar Basin Crop Consulting3
Shannon Gomes, owner of Cedar Basin Crop Consulting, provides services for 25 farmers in Northeast Iowa. Gomes, with his 28 years of consulting experience and a Master’s degree from Iowa State University, has extensive knowledge of Iowa soils and a particular interest in precision management. He emphasizes a scientific approach in his work, advising clients and helping them run trials to assess the many available tools and products on their farms.
Shannon Gomes provides consulting services to 25 farmers in Northeast Iowa and has been using the Adapt-N tool.
Gomes has long been searching for a better way to monitor nitrogen (N) availability and provide precise N recommendations. He’s tried “all the different nitrogen management tools,” with varying results, but has never been satisfied. When he stumbled upon Adapt-N in 2009, he found what he had been looking for: a real-time, location-specific adaptive N recommendation model that accounts for weather, management practices, and field variability. Since then, Gomes’ expertise and enthusiasm have been essential in field-testing Adapt-N over three seasons and introducing the tool to Iowa. He now models all his clients’ corn acres in Adapt-N, using it as both a starting point for his N recommendations, and a teaching tool for understanding complex N dynamics. We spoke with Gomes, his colleague Frank Moore, and two farmer clients—Nick Meier and Ken Humpal—to learn how they are using Adapt-N.
The Farmers
Nick Meier
Nick farms 1200 acres on a corn-soy rotation for grain and seed production. Typical of most farmers in Iowa, he used to apply all his nitrogen in the fall, but now puts on half (80 lb/ac) in the fall, another 30 lb/ac with pre-emergence herbicide, and the remainder (about 50 lb/ac) as an early sidedress application around the V2 stage. Adapt-N simulations of each field, run by Gomes, allow Nick to adjust this final sidedress application based on the spring’s weather conditions and other field-specific factors.
Nick has completed three Adapt-N field trials. In 2012, Adapt-N recommended that he skip sidedressing altogether. There was no yield penalty, and he saved $34/ac on fertilizer and operational costs. Though waiting until sidedress sometimes makes Nick nervous, he appreciates the reduced risk of losses, and is still pushing his N applications later, as much as his comfort level will allow. In 2013, the tool warned that much of the fall-applied N had been lost to rain, and Nick should adjust his sidedress rate upward by 30 lb/ac. The higher rate yielded 14 more bu/ac and +$57/ac profit.
Ken Humpal
Ken raises dairy and beef cattle, corn (grain and silage), soy, and alfalfa on 1700 acres. Like Nick Meier, he used to apply all nitrogen in the fall, but now puts about 50% of the season’s N on as spring pre-plant (anhydrous ammonia) and the rest as sidedress. On sandier ground, he’ll skip the pre-plant altogether and wait for sidedress, because leaching risks are higher.
Ken used late spring soil nitrate tests (PSNT) in the past to determine N rates, adjusting for alfalfa and soybean credits. Now, Ken uses Adapt-N recommendations for all his acres, with minor adjustments. The tool helps account for variation in his fields due to OM content (3-5%), previous crop (corn, soy, alfalfa, or cereal rye cover crop), manure history, and soil type influences. It also helps him track the retention or loss of nitrogen from manure applications, for purposes of nutrient management planning and regulation compliance. Ken completed one Adapt-N field trial in 2011. In this instance, the tool recommended he apply 30 lb N/ac above his usual practice, and the higher rate was justified by a 6 bu/ac higher yield and +$13/ac profit.
Frank Moore
Frank is a consultant colleague of Gomes and a farmer himself. He grows corn and soy on 2000 acres, and develops nutrient management plans for his clients through Three Rivers Ag Consulting. Unlike many Iowa farmers, Frank does not apply N in the fall or at planting but rather applies only 30 lb N/ac with pre-emergence herbicide. The rest of the season’s N is added at sidedress, using Adapt-N-recommended rates. His sidedressing equipment can be driven in corn up to about 18” tall without damaging it, even at this stage. It takes Frank about 5 days to sidedress 1000 acres of corn, but he’s never been rained out. Sidedressing does cost slightly more for the extra trip, Frank says, but it is worth the minimized risk of N losses, and the ability to reduce total N applied in dry years.
Before Adapt-N, Frank applied all N with his pre-emergence herbicide. This system “works about 3 out of 5 years”, he says, but not when you have excessive rain. Using Adapt-N hasn’t greatly changed Moore’s N rates overall, but it has helped him shift more N from spring to sidedress, and adjust for weather. He applied less than normal across his farm in 2012, and more in the wet season of 2013. In addition, Frank completed six trials of Adapt-N on his fields and on average, Adapt-N reduced N rates by 22 lb/ac resulting in insignificant yield and profit changes. Frank says the biggest savings from his N program have come in extreme circumstances. In 2013, when spring weather prevented planting in many fields, Moore estimates he saved $35,000 by avoiding putting N on early!
Using Adapt-N
“When you compare [Adapt-N] to other tools… nothing even comes close,” says Gomes, “and I’ve used all of them!” In a normal weather year, Gomes and his farmers observe that Adapt-N recommends N rates similar to what they would use otherwise. However, the tool is particularly useful in accounting for contrasting weather scenarios. For instance, in the very dry 2012 versus the very wet 2013 springs, Adapt-N helped Gomes “stay ahead of the curve” – recognizing and correcting N shortage in a field before the crop showed signs of deficiency. Adapt-N has allowed growers to reduce N applications by 29 lb/ac on average with no yield penalty, resulting in average savings of $17/ac.
The tool is convenient—it achieves field- and sub-field-level precision without the large sampling effort associated with in-season field-measurements. Before using Adapt-N, Gomes based N recommendations on PSNT samples from a few thousand acres per year. Although many samples can be taken, it’s hard to be sure they are representative. When it rained after sampling, he had to go out and re-sample, or assume that test results were no longer useful. Gomes and Ken Humpal agree they can now monitor soil N availability through Adapt-N – its previous-day high resolution precipitation data gives the closest thing to real-time N measurements, and doesn’t require in-season waiting on the results of lab tests. “I think [Adapt-N] is the thing!” Ken says. Within 24 hours of a rainfall event “you know what you’ve got out there.”
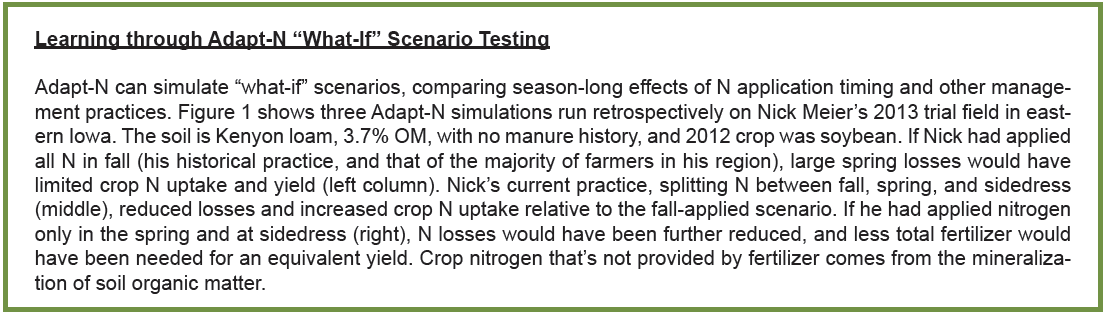
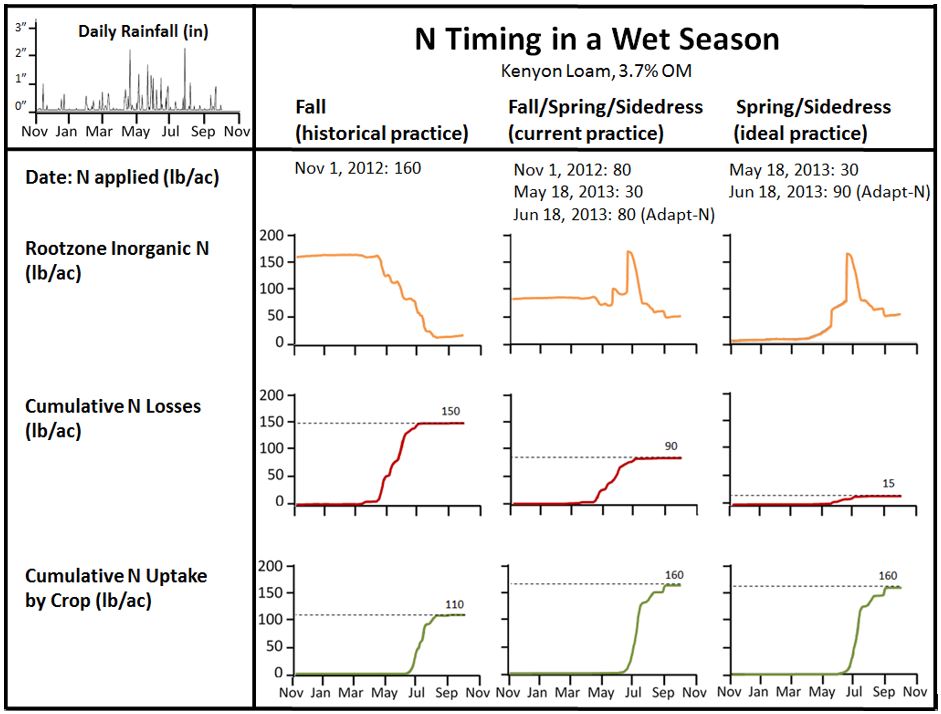
The model provides graphs of available soil N, N uptake and losses, rainfall, temperature, and other factors that are extremely useful as teaching tools, understanding recommendations, and for scenario testing through retrospective runs. For example, from the wet season of 2013 we can see Adapt-N’s “what-if” N timing simulations comparing standard management, Nick Meier’s actual management, and the Adapt-N recommendation (Figure 1; sidebox). This can help a farmer re-examine previous N management programs, and consider the effects of new programs before actually putting them into practice. “The most powerful part of the interface is the graphs,” says Gomes. “You can sit down with a farmer and show them what’s really happening.”
Figure 1. Adapt-N “what-if” simulation of three N timing practices (fall only; fall/spring/sidedress; and spring/sidedress) in a wet season. Adapt-N recommendations in this simulation would have minimize N losses and required less total N for an equivalent yield.
Future Directions
Figure 2. Weather and soil health properties interact to influence soil N dynamics. Such field-scale differences influence physical and biological factors that drive N mineralization and losses as shown in the aerial view of Ken Humpal’s farm.
Gomes is proud that he has persuaded most of his clients to move away from fall N application—a project he’s been working on for quite a while. Now that he uses Adapt-N for recommendations on all client acres, he is able to offer even more incentive to plan on sidedressing, using more precise rates adjusted in season.
Shifting toward sidedress is not without its concerns. Nick and Ken worry about getting rained out and missing the critical window to fertilize, or damaging young corn. Ken remains confident however that sidedressing risks and costs are justified by the additional savings he found during three years of field trials. “I’m excited about Adapt-N,” he says “it’s just a matter of fitting it into the system…” Frank Moore has found great benefit in sidedressing, and risks of rain-out or damage to corn have not caused him problems in his many years using this system. As high-clearance equipment, RTK/GPS, and variable rate technology are becoming more common among growers and custom applicators, the incentives for sidedressing are starting to clearly outweigh the challenges.
What is on Shannon Gomes’ mind for the future? He is strongly interested in soil health testing and helping his clients improve their soil management. Soil health and nitrogen management are closely connected (Figure 2), and Gomes is looking at cover crop and tillage system impacts on soil health and nitrogen dynamics. This way, his farmers can reap the benefits from improved soil health through increased yields and higher N availability, as estimated by Adapt-N.
Quirine Ketterings1, Karl Czymmek1,2, Sanjay Gami1, and Mike Reuter3, Cornell University Nutrient Management Spear Program1, PRODAIRY2, and Dairy One3
Since the introduction of the corn stalk nitrate test (CSNT) as an end-of-season evaluation tool for nitrogen (N) management in 2nd or higher year corn fields, the number of fields that have been tested for CSNT has been on the increase. The greatest benefit of this test is that it allows evaluation and fine-tuning of N management for each specific field. It does, however, require multiple years of testing to gain experience with on-farm interpretation. Corn stalk nitrate test results >2000 ppm indicate there was significantly more N available during the growing season than the crop needed.
The summary of CSNT results for the past eight years is shown in Table 1. In the 2013 and 2014 growing season, the CSNT testing results from the Nutrient Management Spear Program and Dairy One were summarized to obtain a distribution of CSNT categories in New York State. Quality control samples shared between the two laboratories in both years showed excellent consistency in reported data between the two laboratories. Data prior to 2013 reflect submissions to Cornell University only. For 2014, this summary shows that about 36% of all tested fields were over the 2000 ppm range, while 27% were over 3000 ppm and 14% exceeded 5000 ppm. In contrast, 29% of the 2014 samples tested low in CSNT. For 2nd or higher year corn fields, low test results (less than 250 ppm) are likely to reflect a true N deficiency. Weed pressure, disease pressure, lack of moisture, lack of oxygen and other stress factors can impact the N status of the crop, so in some circumstances, additional N might not have been able to overcome the real reason for the low CSNTs (e.g. no amount of N fertilizer can make up for a drought).
As mentioned, the CSNT is most effective when used for multiple years on the same fields to determine how each responds to the way N is being managed. Crop history, manure history, other N inputs, soil type, and growing conditions all impact CSNT results, and crop management records that include these pieces of information can be used to evaluate CSNT results and determine where changes can be made.
Bianca Moebius-Clune, Margaret Ball, Harold van Es, Jeff Melkonian – School of Integrative Plant Science, Soil and Crop Sciences Section – Cornell University
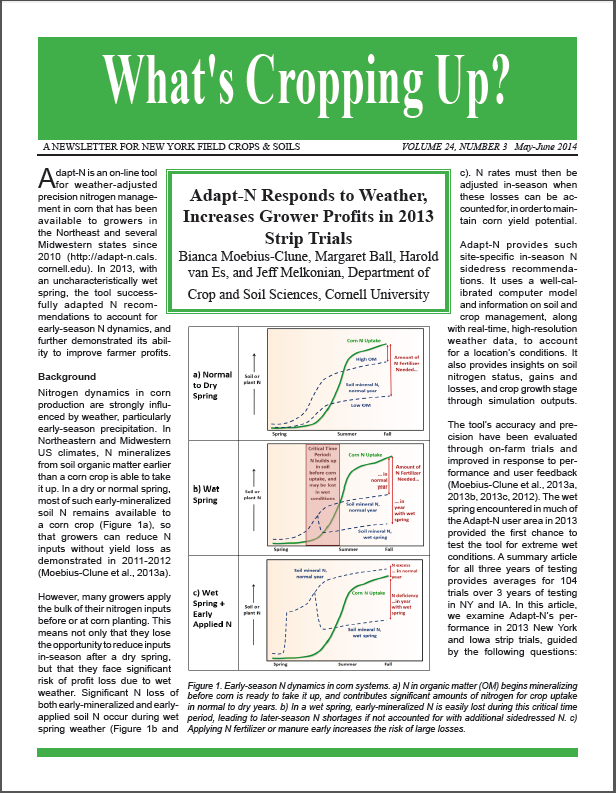
Adapt-N is an on-line tool that provides location-specific, weather-adjusted nitrogen (N) recommendations for corn. At sidedress time, critical early-season weather that strongly influences actual N needs is incorporated into the recommendation. To accomplish this, the tool uses 1) a simulation model that was developed and calibrated through field research over several decades, 2) high resolution 2.5 x 2.5 mile daily temperature and precipitation information, and 3) soil and crop management information entered via a web interface on any internet-capable device. Adapt-N’s cloud-based environment (central data server, high security, and accessibility through desktop, laptop and mobile devices, future embedding in other farm software) offers a user-friendly experience.
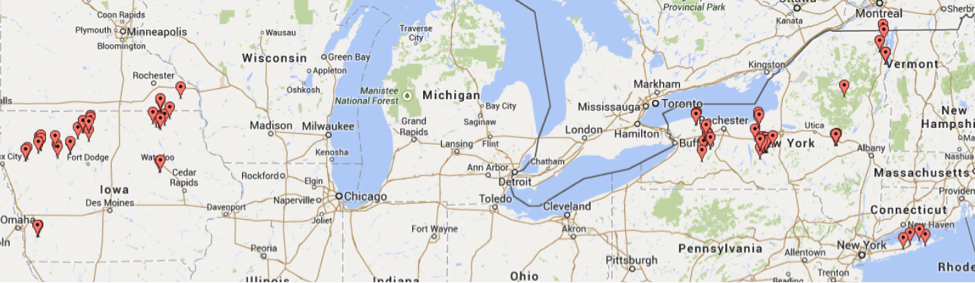
We conducted a total of 104 strip trials in 2011, 2012, and 2013 in New York and Iowa (Figure 1) to beta test Adapt-N for its ability to improve recommendations for corn N need at sidedress time. Yield data and simulated losses across trials show that the Adapt-N tool significantly increased grower profits, while decreasing N inputs and environmental losses, as summarized in this article. In 2014, Adapt-N was commercialized through a public-private partnership between Cornell University and Agronomic Technology Corporation (ATC, see http://www.adapt-n.com/). The partnership aims to sustain and broaden the tool’s availability, customer service, usability, and integration with existing farm management technologies, while allowing for continued research and development at Cornell University.
Methods
We completed 67 replicated strip trials in New York (14 in 2011; 42 in 2012; 11 in 2013) and 37 trials in Iowa (9 in 2011; 19 in 2012; 9 in 2013) on commercial and research farms throughout each state (Figure 1. One 2012 trial in Minnesota is included with the Iowa trials).
Figure 1. Map of 2011-2013 trial locations (map courtesy of batchgeo.com)
Sidedress treatments involved at least two rates of nitrogen, a conventional “Grower-N” rate based on current grower practice (G) and an “Adapt-N” recommended rate (A). An Adapt-N simulation was run for each field just prior to sidedressing to determine the optimum weather-adjusted N rate.
Table 1. Agronomic, economic and environmental assessment of model performance in 2012. Values are average differences resulting from Adapt-N use (Adapt-N minus Grower-N treatment) such that a negative number shows a decrease due to Adapt-N, a positive number shows an increase due to Adapt-N. *Simulated N leaching losses and N total losses do not include 2011 IA trials – data not available.
Yields were measured by weigh wagon, yield monitor, or in a few cases by representative sampling (two 20 ft x 2 row sections per strip). Partial profit differences between the Adapt-N and Grower-N practices were estimated using prices of $0.50/lb N, $5/bu grain, $50/T silage, and $8/ac operational savings if sidedress was avoided in either the Adapt-N or Grower treatment. Yields were used as measured, regardless of statistical significance, since the statistical power to detect treatment effects for a single experiment is inherently low.
Total N losses to the environment (atmosphere and water) and N leaching losses were simulated by Adapt-N for each N treatment, through the end of each growing season. End dates for N loss simulation were October 30, 2011 (NY trials only), December 15, 2012, and December 31, 2013.More detailed descriptions of each year’s methods and results were provided in previous WCU articles (Moebius-Clune et al., 2012, 2013, and 2014).
Agronomic and Economic Comparison
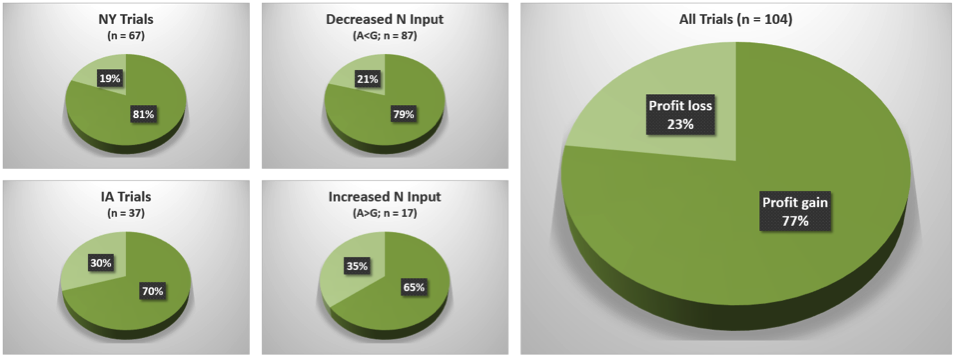
Adapt-N rates resulted in average N input reductions of 52 lbs/ac in NY, 29 lbs/ac in IA, and 44 lbs/ac overall (Table 1). Profit gains from the use of Adapt-N were considerable. Profits increased in 81% of all NY trials, in 70% of all IA trials, and in 77% overall when growers followed Adapt-N recommendations (Figure 2). Profit gains of $30/ac on average ($37/ac in NY, $17/ac in IA) were obtained most frequently due to reductions in N inputs, without significant yield loss: +1 bu/ac on average across all trials. Most collaborating growers were already using progressive N management including sidedressing, so that benefits achieved in these trials can be considered to be a conservative estimate of potential benefits of using Adapt-N. Benefits will be higher for growers who currently use few N best management practices.
Figure 2. Proportion of trials with profit gains (dark green) or losses (light green) as a result of using the Adapt-N recommendation compared to current grower N management in 2011-2013 trials. With appropriate use of the most up-to-date version of Adapt-N, success rates can be further improved.
Decreased N rates: Adapt-N recommended a lower N rate than grower practice in 84% of trials, by 60 lbs/ac on average (Table 1). Such recommendations occurred after a normal or dry spring, when N from spring mineralization or early fertilizer applications remains available to the crop. Yield losses were generally minor, averaging -2 bu/ac across trials with N reductions, and leading to profit gains in 79% of cases – on average $23/ac (Table 1, Figures 2 and 3). This implies that a grower is about four times more likely to achieve increased profit from a reduced Adapt-N rate than from their current higher rate. This statistic includes all trials over three years, although model improvements have been made each year based on trial information, such that actual probabilities of increased profit with reduced N inputs are likely further improved for future years.
Increased N rates: Even larger profit gains of $65/ac on average were achieved when Adapt-N recommended increasing N inputs over the grower’s current practice in 16% of trials. Consequent average yield increases of 17 bu/ac across these trials were achieved for an average additional 38lb/ac fertilizer application (Table 1). Such higher recommendations occurred primarily in 2013 ($94/ac profit on average in NY 2013 trials), and in select locations in other years, after a wet spring. Needs for additional N were correctly identified in 65% of these cases, resulting in significant yield and profit increases. In 35% of cases, on the other hand, the additional N was not needed. In almost all of these cases, unpredictable post-sidedress drought decreased yield potential below the expected yield that was used for the recommendation at the time the sidedress rate decision had to be made (Moebius-Clune et al., 2013).
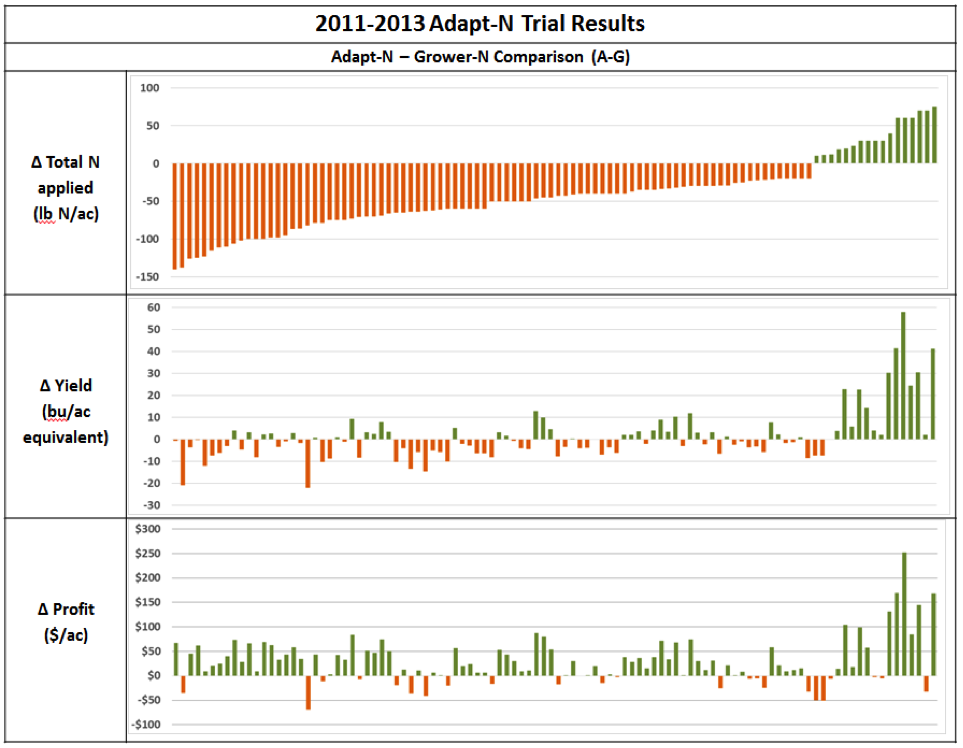
Profit loss when under-fertilizing (from reduced yields) is generally larger than when over-fertilizing (from unnecessary fertilizer application). Thus lower recommendations to account for potential future yield-limiting events cannot be justified for economical sidedress recommendations. By contrast, pre-sidedress weather events affecting yield potential and N availability are known, and Adapt-N can effectively manage this risk. Therefore, the chances of over-recommending N inputs are somewhat higher than those of under-recommending, further decreasing risk of profit loss. For illustration, overall, profit gains greater than $50/ac occurred in 29 cases, while losses greater than $50/ac were determined in only 2 cases (Figure 3).
Figure 3. Results from each trial (n = 104) are vertically aligned. Bars show difference between Adapt-N and Grower treatments (A-G) such that negative numbers (orange) show decrease due to Adapt-N, and positive numbers (green) show increase due to Adapt-N.
Environmental Benefits
Adapt-N reduced N rates in 84% of cases, by 60 lbs N/ac on average, resulting in simulated reductions in total N losses to the environment by the end of the growing season of 34 lbs/ac, and leaching losses by 10 lbs N/ac (Table 1). Further losses of residual excess N generally occur over the winter and spring months when crop uptake ceases, soil water is recharged, and saturation or near-saturation occur, particularly in the Northeast. Thus the simulated reductions are a low estimate of actual environmental loss reductions, which are likely closer to the difference in applied N. In 16% of trials, where Adapt-N increased N rates, by 38 lbs/ac on average, total N losses increased on average by only 16 lbs/ac, and leaching losses by 3 lbs/ac. Further over-winter losses in these cases are lower, because much of the additional applied N was taken up by the crop to produce the increased yield, and thus would not be lost.
Lessons for Expert Use of Adapt-N from three years in the field
Growers can decrease risk of N deficiency, environmental losses, and yield losses, and increase profit margins. To optimize Adapt-N use, we recommend the following:
Plan to apply the majority of fertilizer nitrogen at sidedress time instead of prior to or at planting. If manure is applied prior to planting or when enhanced efficiency products are used, aim for conservative rates.
Monitor the field’s N status and account for early season weather impacts on N availability by using Adapt-N’s daily updates.
Supply input information on soil and crop management that is representative of each management unit (e.g. test soil and manure based on representative samples, keep good records of operations, estimate expected yield as the second-highest out of 5 years of accurate yield information). For each management unit, measure soil organic matter at least every 3 years, ideally to a 12” depth.
If appropriate, adapt input information at the time of sidedressing to account for seasonal influences, such as decreased yield potentials or shallow rooting depths from extreme wet conditions.
Use the most recent Adapt-N recommendation available on sidedress day. Apply sidedress N between V6 and V12, depending on N and equipment availability. Generally, later sidedressing with high-clearance applicators allows for more accurate recommendations. Variable rate applicators can be used to adjust Adapt-N simulations for management units in fields.
Use Adapt-N scenario simulations after the growing season to learn more about how weather and management influence N availability.
In the long term, manage for healthy soils and use Adapt-N to account for N contributions from high organic matter levels and deep root zones.
Conclusions
Three consecutive growing seasons involving 104 on-farm strip trials demonstrate that Adapt-N is an effective tool for N management in corn systems, with average profit gains of at least $30/ac. With model improvements and increased expert use of the tool, we estimate that profit gains over current grower practices can be expected in at least four out of five cases. Adapt-N generally correctly identified cases when either decreased or increased N was needed to maintain yields. The tool also provides a strong incentive to shift N applications to sidedress time when weather impacts can be accounted for in the model. By using Adapt-N, growers can contribute to solving persistent problems with greenhouse gas emissions, groundwater pollution, and hypoxia in our estuaries, while increasing profits in both wet and dry years.
For more information: Recorded webinars, a manual, and other Adapt-N training materials are available at http://adapt-n.cals.cornell.edu/. The Adapt-N tool is accessible through any device with internet access, now from the team’s commercial partner, Agronomic Technology Corporation, at http://www.adapt-n.com/ (cost is about $1-3/ac, depending on area covered). Adapt-N users can elect to receive email and/or cell phone alerts providing daily updates on N recommendations and soil N and water status for each management unit in Adapt-N.
Acknowledgements: This work was supported by funding from the NY Farm Viability Institute, the USDA-NRCS Conservation Innovation Program, the International Plant Nutrition Institute, McKnight Foundation, Walton Family Foundation, USDA-NIFA, MGT Envirotec, and USDA-SARE. We are grateful for the cooperation in field activities from Keith Severson, Kevin Ganoe, Sandra Menasha, Joe Lawrence, Anita Deming, Harry Fefee, Kitty O’Neil, Mike Hunter, and Brent Buchanan of Cornell Cooperative Extension, Bob Schindelbeck of the Cornell Section of Soil and Crop Sciences, Mike Davis at the Willsboro Research Farm, Dave DeGolyer, Dave Shearing and Jason Post at Western NY Crop Management Association, Eric Bever and Mike Contessa at Champlain Valley Agronomics, Eric Young at Miner Institute, and Peg Cook at Cook’s Consulting in New York, and from Shannon Gomes, Hal Tucker, Michael McNeil, and Frank Moore at MGT Envirotec. We also are thankful for the cooperation of the many farmers who implemented these trials on their farms.

 The full version of What’s Cropping Up? Volume 25, No. 1 is available as a downloadable PDF and on issuu. Individual articles are available below:


 such that a negative number shows a decrease due to Adapt-N, a positive number shows an increase due to Adapt-N.")