
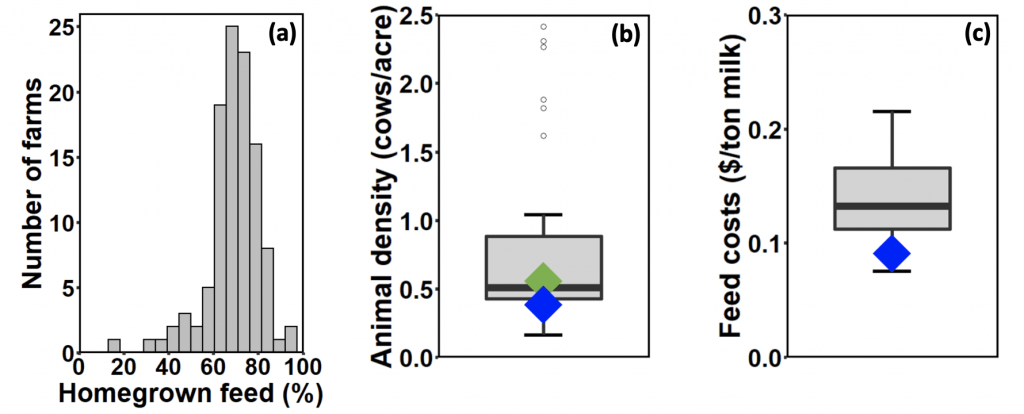
Figure 1: (a) The share of homegrown feed on New York dairy farms participating in the 2017-2019 nutrient mass balance assessment (histogram); (b) the average number of mature cows per acre of cropland on dairy farms in the US (boxplot) and on New York dairy farms (blue diamond) according to the 2017 USDA Census of Agriculture, and the average number of mature cows per tillable acre for New York dairy farms participating in the 2017-2019 nutrient mass balances (green diamond); (c) the average amount spent on purchased feed per ton of milk sold for US dairy farms (boxplot) and New York dairy farms (blue diamond) according to the 2017 USDA Census of Agriculture.
