Tag Archives: weather stations

Save time during the season with a winter weather station checkup

Well-maintained weather stations are the secret to maximizing NEWA as part of a successful crop management strategy. A good maintenance plan provides peace of mind and ensures the best possible information is used to calculate NEWA model results. Checking your machine now means you have time for repairs without the pressure of in-season activities. Read this article to give your unit a complete checkup for the 2020 growing season.

Check Your Surroundings

Barns, windbreaks, equipment and other objects in close physical proximity to your machine can interfere with many sensor measurements, affecting both their precision and accuracy. Shading from a tall tree or building will reduce solar radiation readings, affect ambient temperature, relative humidity, and even windspeed for example. Consider relocating your weather station if you think nearby structures, objects, or permaculture interfere with air flow or sunlight. A minimum distance of 100 ft is a good rule of thumb.

Clean your sensors

  • Anemometer and weather vane. Check that your wind speed and wind direction sensors move freely. If either resists movement or is stuck, consider replacement.
  • Solar radiation. Use a step ladder to closely inspect the sensor. Use a clean damp cloth to remove dirt and debris if necessary. If the protective lens looks opaque, contact your vendor to discuss replacement.
  • Rain gauge. Use a step ladder to closely inspect the rain buck interior. Carefully remove any leaves, spider webs, or other debris commonly found in clogged rain gauge sensors.
  • Temperature/relative humidity. Inspect the solar radiation shield for insect nests or spider webs. These block free airflow to the sensors housed inside. Clear debris with a soft bristle brush if necessary.
  • (Leaf) wetness. Check that the wetness sensor is secured at a 30° angle facing north. Clean debris using a clean damp cloth.
  • Soil sensors. Inspect cords leading from the computer housing to the ground for mechanical or rodent damage. Contact your vendor if parts need replacement.

Look at Your Data

Log into your weather station platform and spend a few minutes looking back at data trends over the past season. Does anything jump out at you or seem unusual? You should be looking at your raw data, either on NEWA or in your vendor’s online platform, to be familiar with how your station data ‘behaves.’ It will be easier to quickly flag issues when they arise in the future.

Know How to Reach Your Vendor

Add your vendor’s support number to Contacts in your phone. If you encounter a problem, don’t put it off. Leave a message with your supplier if their support staff are busy. Rainwise Support is 207.801.4039. Onset Support is 1.800.564.4377.

Don’t wait to get help

Our weather station vendor partners are always ready to help. But if you aren’t sure where to start, want clarification, or think there might be an issue with the NEWA site, you can reach out at any point to the NEWA Help Desk at support@newa.zendesk.com.
Lake Erie Regional Grape Program expands NEWA coverage

Grape growers in the Lake Erie region of Western New York and Northwest Pennsylvania have expanded access to NEWA grape models and resources thanks to the recent addition of new weather stations throughout the region where LERGP collaborators have been working to expand NEWA coverage for grape growers along the Lake Erie and Lake Ontario growing regions.

NEWA and University at Albany’s NYS Mesonet entered into a new agreement this spring to provide high-quality weather data from Burt and Fredonia locations. National Grape Cooperative, Constellation Brands, and Walker’s Fruit Basket also funded the purchase, installation, and maintenance of 9 additional Rainwise weather stations.

There are now 26 active NEWA locations in the Lake Erie and Lake Ontario grape growing regions of NY and PA.

Tim Weigle, NYS IPM Statewide Grape IPM Specialist, reports that 70% of respondents to a 2018 NY vineyards survey already use NEWA. Many participants who don’t currently use NEWA indicated that lack of access to model results from nearby weather stations was the primary limitation to greater usage. Addition of these 11 new stations to the network in Western NY will help reduce this barrier for growers interested in using NEWA grape disease and insect models.

Do you NEWA?

Watch this YouTube video that features Tim Weigle as he discusses many more details of recent NEWA expansion in Western NY.

Using NEWA to access historical data

Did you know NEWA can load past weather data into your favorite online tool at newa.cornell.edu? It’s the dead of winter which is a perfect time to look back at the 2017 growing season. Read this article to learn more about historical data access using NEWA.

Historical data access | Historical data from inactive stations | Historical data summary

NEWA historical data access

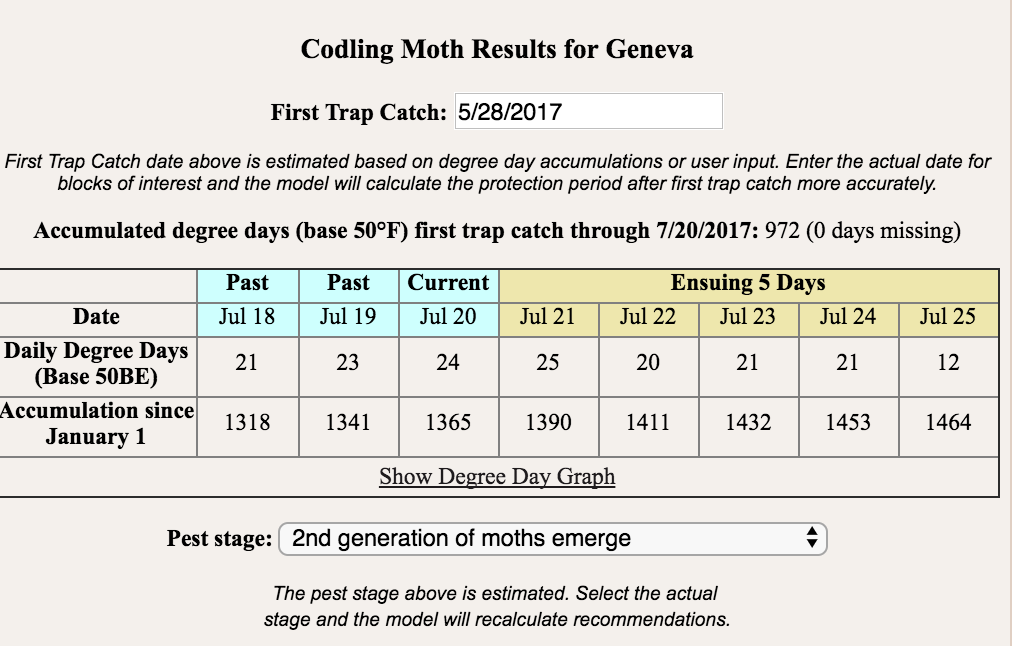
The NEWA website is popular because real-time weather data provide short-term risk assessments during the growing season. But, have you ever looked back and asked yourself what went right or wrong? NEWA tools can also be used to follow insect or disease risk historically through a period of time. You can access this feature using any model or tool available on the NEWA website.

Instructions

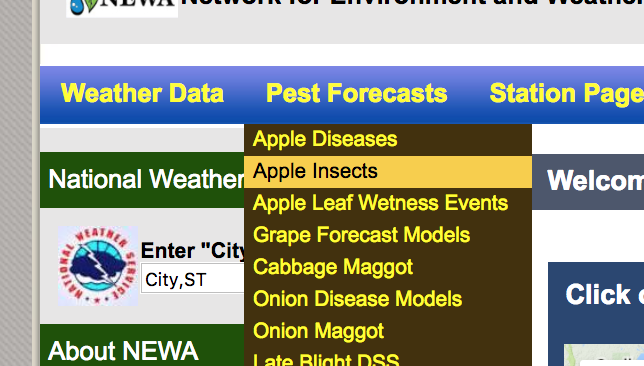
From the ‘Weather Data,’ ‘Pest Forecasts,’ or ‘Crop Management’ dropdown lists in the website navigation bar, select your model of interest.
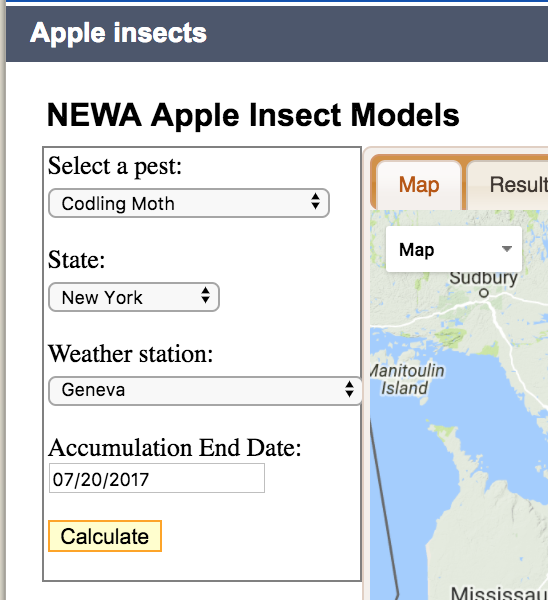
 Select your pest or disease, State, and Weather station and historical Accumulation end date.
View the historical output.
 

NEWA historical data access from ‘Inactive’ Stations

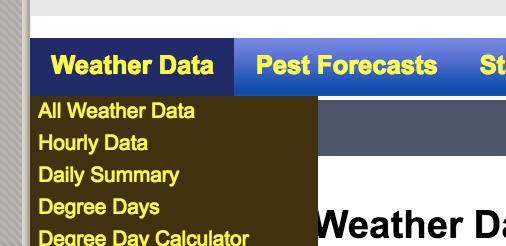
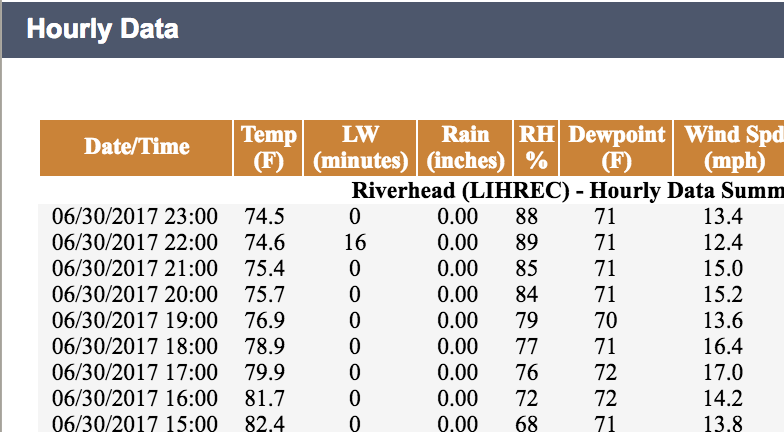
Every once in a while, we get a question about historical data from an ‘inactive’ station, which is a NEWA location that no longer transmits to the website. Historical weather data can still be accessed using the hourly or daily weather summary tools.

Instructions

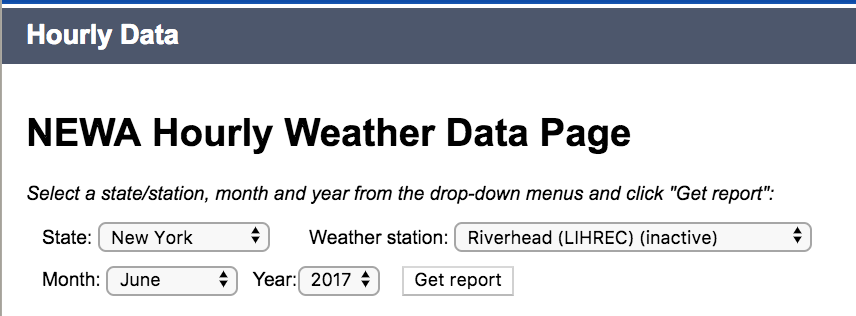
From the ‘Weather Data’ dropdown list in the website navigation bar, select Hourly Data or Daily Summary.
Scroll to the bottom of available weather stations and find a station of interest.
Choose a month and year from the past.
Get your report.

Historical data access summary

This table summarizes the availability of NEWA models and tools with ‘active’ and ‘inactive’ stations on NEWA. Follow the links to view tools and resources at the NEWA website.

Category Crop Model type Model From active stations From inactive stations
Fruit Apple Diseases Apple scab  YES NO
Fire Blight YES NO
Insects Apple Maggot YES NO
Codling Moth YES NO
Oriental Fruit Moth YES NO
Obliquebanded Leafroller YES NO
Plum Curculio YES NO
San Jose Scale YES NO
Spotted Tentiform Leafminer YES NO
Crop Management carbohydrate thinning model YES NO
Irrigation model YES NO
Grape Diseases Phomopsis YES NO
Powdery Mildew YES NO
Black Rot YES NO
Downy Mildew YES NO
Insects Grape Berry Moth YES NO
Vegetable Cabbage Insects Cabbage Maggot YES NO
Onion Diseases Botrytis YES NO
Downy Mildew YES NO
Purple Blotch YES NO
Insects Onion Maggot YES NO
Potato Diseases Early Blight YES NO
Late Blight YES NO
Tomato Diseases Early Blight, Septoria, Anthracnose YES NO
Late Blight YES NO
Weather Summaries Hourly YES YES
Daily YES YES
 Degree Days Summaries Monthly YES NO
 Calculator  YES NO