Why Did Organic Compared with Conventional Corn Yield ~30% Lower During the First Transition Year?

 Bill Cox1 and Eric Sandsted1
1Soil and Crop Sciences Section – School of Integrated Plant Science, Cornell University

We initiated a 3-year study at the Aurora Research Farm in 2015 to compare the corn, soybean, and wheat/red clover rotation under conventional and organic cropping systems during the 3-year transition period (2015-2017) to an organic cropping system. We used three entry points or previous crops from 2014 to initiate the 2015-2017 study: 1) grain corn, 2) small grain, and 3) soybean. Three of the many objectives of the study are 1) to determine the best previous crop (2014) for the transition, 2) the best crop to plant in the first year (2015) during the transition and 3) do corn, soybean, and wheat respond similarly to management inputs (high and recommended) under conventional and organic cropping systems? We reported in a previous article corn management inputs (hybrid selection, planting date, seeding and N rates, and weed control) under both cropping systems (https://blogs.cornell.edu/whatscroppingup/2015/11/09/corn-yield-under-conventional-and-organic-cropping-systems-with-recommended-and-high-inputs-during-the-transition-year-to-organic/). Likewise, we reported in the same article that corn yielded ~30% lower in the organic compared with the conventional cropping system. Furthermore, management inputs did not impact corn yields under either cropping system. This article will examine the yield component responses of conventional and organic corn averaged across the three previous crops and both management treatments to partially explain why organic corn yielded so much lower in 2015.

Corn populations, averaged across the three previous crops, were lower at the V9 stage between the organic (~25,000 plants/acre in the recommended and ~31,450 plants/acre in the high input treatments) compared with the conventional cropping system (~28,500 plants/acre in recommended and ~34,265 in high input treatments) when counting all the plants in the two harvest rows (https://blogs.cornell.edu/whatscroppingup/2015/07/23/emergence-early-v4-stage-and-final-plant-populations-v10-psnt-values-v4-and-weed-densities-v12-in-corn-under-conventional-and-organic-cropping-systems/). We subsampled two 1 meter lengths of the two harvest rows (hand-harvested all the plants, pulled off the ears and dried them, shelled the ears, counted the kernels, and weighed all the kernels-~6000-7000/sample or 12000-14000 kernels/sub-sampled area) in two regions of our 100 foot plots about a week before harvest. When averaged across the three previous crops and two management systems, plant populations in the sub-sampled areas averaged 7.95 plants/m2 (~31,380 plants/acre) in conventional corn compared with 7.02 plants/m2 (~28,225 plants/acre) in organic corn (Fig.1). The sub-sampled populations averaged only 3% higher in conventional corn and 2% higher in organic corn compared with populations in the entire plot indicating that the sub-sampled areas were very representative of the entire plot area.

Fig.1. Corn population (plants/m2), averaged across the three previous 2014 crops and two management input treatments, in two subsampled areas (1.52 m2) of each plot in the conventional and organic cropping systems at the Aurora Research Farm in 2015. Error bars represent the standard error of the means.

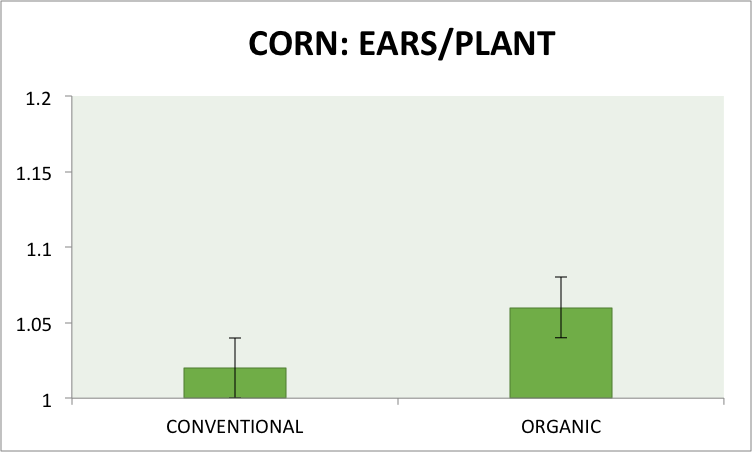
When averaged across the three previous crops and two management treatments, conventional corn averaged 1.02 and organic corn averaged 1.06 ears/plant (Fig.2). Typically, hybrids, even modern hybrids, will produce a second ear under low plant populations, although 7.02 plants/m2 is not an exceedingly low final stand. Surprisingly, conventional corn averaged 557 kernels/ear and organic corn only 474 kernels/ear (Fig.3). Corn typically produces more kernels/ear at lower compared with higher final stands because of less intra-plant competition for light, water, and nutrients. Given that the genetics of the hybrids were similar (P9675 and P9675AMXT), except for the GMO traits, in both cropping systems, organic compared with conventional corn should have had greater kernels/ear. Undoubtedly, the lower kernel number per ear as well as the lower final plant populations were major factors in lower organic compared with conventional corn yields.

Fig.2. Ears/plant, averaged across the three previous 2014 crops and two management input treatments, in two subsampled areas (1.52 m2) of each plot in the conventional and organic cropping systems at the Aurora Research Farm in 2015. Error bars represent the standard error of the means.
Fig.3. Kernels/ear, averaged across the three previous 2014 crops and two management input treatments, in two subsampled areas (1.52 m2) of each plot in the conventional and organic cropping systems at the Aurora Research Farm in 2015. Error bars represent the standard error of the mean.

When averaged across the previous crops, seed mass averaged 254 mg in conventional corn but only 240 mg in organic corn (Fig.4). Typically, corn at higher final stands has lower seed mass (weight of an individual kernel) than corn at lower final stands again because of greater intra-plant completion. (Corn with fewer kernels/ear also typically has greater seed weight). So the lack of yield component compensation by organic corn (no increased kernel number and kernel weight in the presence of lower final stands) appears to be the major factor in lower organic corn yields.

Fig.4. Kernel weight (mg), averaged across the three previous 2014 crops and two management input treatments, in two subsampled areas (1.52 m2) of each plot in the conventional and organic cropping systems at the Aurora Research Farm in 2015. Error bars represent the standard error of the means.

If you multiply out the yield components (plants/m2 x ears/plant x kernels/ear x kernel weight), the sub-sample yields averaged 182 bushels/acre in corn compared with 134 bushels/acre in organic corn. Although the sub-sample yields were ~10% greater than the actual plot yield in conventional corn (165 bushels/acre along the 100 foot long plot yield) and ~18% higher in organic corn (113 bushels/acre for the plot yield), we believe that the sub-sample yield component data provide a valid explanation for the lower organic corn yields. In fact, organic vs. conventional corn in the sub-sampled area yielded 26.5% lower compared with 31.5% for the plot yield, which is fairly similar.

Why the lack of yield component compensation for the organic corn in 2015? We presented weed count data in a previous article that showed organic corn averaged ~2.25 weeds/m2 compared with 0.4 weeds/m2 in conventional corn at the V12 stage (https://blogs.cornell.edu/whatscroppingup/2015/07/23/emergence-early-v4-stage-and-final-plant-populations-v10-psnt-values-v4-and-weed-densities-v12-in-corn-under-conventional-and-organic-cropping-systems/). Certainly, severe weed pressure could reduce kernel number and kernel weight, especially if weed densities are high early in the growing season. However, visual observations revealed that 95% of the organic corn plot was weed-free and the higher weed densities were mostly because of clumps of weeds in small sections along the plot length. So higher weed counts may have contributed slightly to the lower kernel number and kernel weight in organic corn but we do not believe that it was the major factor.

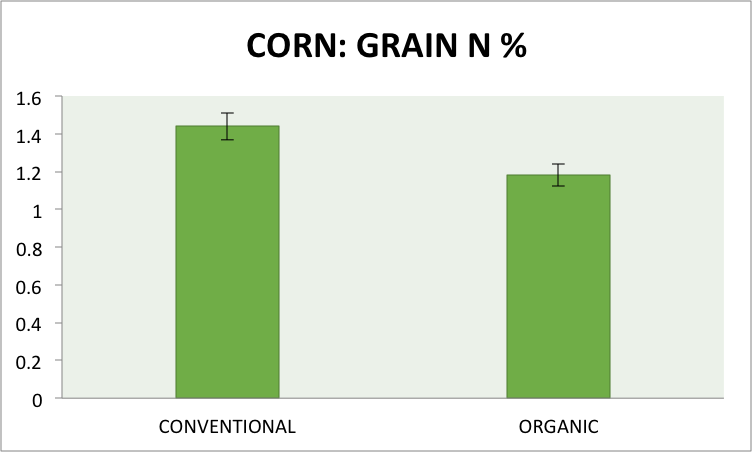
Instead, visual observations indicated N deficiency in organic corn throughout the season and stalk nitrate and grain N data confirm those observations (Fig.5 and 6). Stalk nitrate concentrations of conventional corn, which averaged ~450 ppm, indicated only marginal N status for maximum yield probably because of dry soil conditions during the grain-filling period (only 2.75 inches of precipitation from silking through black-layer formation). Organic corn had stalk concentrations of only ~50 ppm, which indicates severe N deficiency. Some have questioned the accuracy of the stalk nitrate test, as it relates to organic corn, and the exceedingly low values of 50 ppm reinforce that concept. Grain N concentrations, however, also indicate lower N in organic corn (1.18%) compared with conventional corn (1.44%). Given, the visual symptoms of N deficiency of organic corn during the growing season, coupled with the extremely low stalk nitrate and the lower grain N concentrations, we believe that N availability was probably the major factor in the lower organic corn yields.

Fig.5. Stalk nitrate concentrations (ppm), averaged across the three previous 2014 crops and two management input treatments, in two subsampled areas (1.52 m2) of each plot in the conventional and organic cropping systems at the Aurora Research Farm in 2015. Error bars represent the standard error of the means.
Fig.6. Grain N concentrations (%), averaged across the three previous 2014 crops and two management input treatments, in two subsampled areas (1.52 m2) of each plot in the conventional and organic cropping systems at the Aurora Research Farm in 2015. Error bars represent the standard error of the means.

Apparently, the composted chicken manure applied pre-plant to organic corn the day before planting (May 23) either denitrified because of extreme wet June conditions (8.00 inches of rain) or just did not mineralize enough to meet the N demand of corn (the majority of N fertilizer to conventional corn was side-dressed in late June so did not experience this problem). This would result in N deficiency in the 2 week period before and after silking (~July 15-August 10), the growth period when final kernel number in corn is determined. Likewise, a lack of N from 2 weeks after silking to a week before black layer formation (~August 10-September 10) would result in lower kernel weight. So low N availability probably contributed the most to lack of yield component compensation of organic corn (15% fewer kernels/ear and 5.5% lower seed weight for organic corn), in the presence of lower final stands (~12% fewer plants/m2), which contributed to 31.5% lower yields for organic compared with conventional corn.

In defense of organic corn, we did not know about funding for this research until mid-April of 2015 so the typical green manure crop or animal manure was not used on organic corn. Consequently, organic corn was not given the best N management practices during the first transition year. If corn is selected as the first year transition crop, a small grain crop with a red clover inter-seeding or a field with recent animal manure applications would be the best management strategy. The green manure crop or animal manure would provide the majority of the N requirement of organic corn and composted chicken manure could be used as a supplemental N source. Fortunately, we have a robust red clover crop in place so we expect organic corn to perform much better relative to conventional corn in 2016.


Estimating Fall N Uptake by Winter Cereals Seeded as Cover or Double Crops after Corn Silage Harvest

Zhehan Tang1, Quirine Ketterings1, Karl Czymmek1,2, Sheryl Swink1, and Paul Cerosaletti3
1Cornell University Nutrient Management Spear Program, 2PRODAIRY, Department of Animal Science, 3Cornell Cooperative Extension of Delaware County

Figure 1: Winter cereals, including wheat, cereal rye and triticale, are increasingly used as cover crops after corn silage as they can reduce erosion risk, add organic matter to the soil, and capture end of season nitrogen.

Nitrogen (N) is essential for crop production, but crop N needs are difficult to predict due to uncertainty of the weather and inability to accurately predict N supply and loss. As a result, it is not unlikely that we have excess N at the end of the growing season. This excess N can be lost to the environment through leaching (most typical in well-drained soils) or denitrification (more likely in poorly drained soils). Cover crops planted after the harvest of a main crop like corn can take up and sequester some of this end-of-season N (in addition to sequestering carbon) and thus carry some N over to the next year. Winter cereals, including wheat, cereal rye and triticale, are increasingly used as cover crops as they have a greater cold tolerance than many other cover crops. In New York, winter cereal biomass accumulation in the fall, when seeded after corn silage harvest, typically ranges from 0.25 to 1 ton per acre (Figure 1) for a typical N uptake of 20-30 lbs N/acre (Ort et al., 2013).

Estimating N Content of Cover Crops

Figure 2: Relationship between above ground biomass of dry matter (tons/acre) and the total N (lbs/acre) uptake by winter cereal between seeding after corn silage and a killing frost in late fall or early winter.

In the past six years, we have measured fall biomass of winter cereals to determine fall N uptake, in collaboration with farm advisors and farmers throughout New York State. This was done to determine total N uptake and carbon sequestration under New York growing conditions in rotations where the winter cereal was seeded after corn silage harvest. The assessment showed that there is a strong linear relationship between the above ground biomass (shoot only) and total N uptake (roots and shoots combined) of wheat, cereal rye, and triticale in New York (Figure 2). The differences in N content among the three species were very small as long as the total biomass was less than 1.2 tons of dry matter per acre.  The relationships between above ground biomass and total N uptake were very consistent among different locations (farm fields), suggesting that the equations in Figure 2 can be used independent of soil type. This allows a farmer or farm advisor to determine the above ground biomass of these winter cereals in his or her field and then estimate total (below and above ground) N in the cover crop.

Step-wise Protocol to Determine N Uptake

Because total N uptake and above ground biomass are so closely related for these winter cereals, we can use the relationship between total N content in winter cereal cover crop and its above ground biomass (shoots) to determine total N uptake in a step-wise approach:

  1. Create a sampling frame (for example a 24 by 12 inch wooden frame) and precisely measure its length and width in inches.
  2. Place the sampling frame in a representative location of the field whose biomass and N content you want to estimate. Clip all above ground biomass of the winter cereal that is within the frame, as close to the soil surface as possible, while avoiding soil contamination, and place the sample within a bag large enough for samples from 3 frames. Sample when the plants are dry (avoid sampling when there is dew, rain, or snow).
  3. Repeat the sampling process at two more representative sites in the field, collecting samples from all three locations in the same bag.
  4. Measure the total weight of the sample collected in pounds (lbs). Make sure to subtract the bag weight itself so that only plant weight is included in the total.
  5. If your sample does not have much external moisture, you can assume it has about 18% dry matter, then skip step 6 and continue with step 7. If you want to estimate total biomass and N content more precisely, continue with step 6.
  6. After carefully mixing the sample in the sampling bag, take a subsample of approximately 0.25 lbs from the harvested biomass, and determine the weight of the subsample in pounds (if the weight of the total sample is 0.25 lbs or less, skip the step of taking a subsample). Dry the subsample with a microwave until it has obtained a stable weight. Use short drying periods of 30-60 seconds and place an 8-oz glass of water in the corner to avoid burning of the sample. More detailed instructions for drying of plant biomass with a microwave can be found at http://extension.psu.edu/publications/i-106. Once the weight has stabilized, measure the final dry weight. The dry weight divided by the initial weight is the percent dry matter. If you have a scale that measures in grams, you can also weigh 100 grams of freshly harvested biomass, dry it following the same procedure, and weigh the dry weight at the end of the drying process; the dry weight will be the dry matter percent.
  7. Once you have all data collected, download the Cornell University “Fall Nitrogen and Carbon Pools of Winter Cereals” excel spreadsheet calculator from the Nutrient Management Spear Program website ((http://nmsp.cals.cornell.edu/software/calculators.html). Select the species and enter your information for frame length, frame width, number of samples taken, total wet weight, subsample wet and dry weight. The calculator (Figure 3) will report the percent carbon (C) and N, the ratio of both (C:N ratio), estimated biomass (tons/acre dry matter), and total carbon and N pools (lbs/acre). Table 1 shows the N content of different winter cereals.

    Figure 3: Cornell University “Fall N and Carbon Pools of Winter Cereals” excel spreadsheet calculator.
    Figure 3: Cornell University “Fall N and Carbon Pools of Winter Cereals” excel spreadsheet calculator.

In Summary

Cover crops are important for erosion control and soil health. In addition, winter cereals are effective in taking up N in the fall. We developed a calculator to estimate how much N is accumulated by the onset of the winter in winter cereals planted as cover crops (biomass less than 1.2 tons of dry matter per acre; winter cereals seeded after corn silage or soybean harvest only). This calculator converts estimates of the above ground biomass to total N uptake and carbon sequestration by the winter cereal (roots and shoot combined).

Web-Based Resources and References

Acknowledgments

NMSP ackFunding sources included the Northern New York Agriculture Development Program (NNYADP), a USDA-NRCS Conservation Innovation Grant, Northeast Region Sustainable Agriculture Research and Education, and Federal Formula Funds. We thank the many Cornell Cooperative Extension field crop educators, Soil and Water Conservation District staff and participating farmers, and our past and current NMSP team members Greg Godwin, Sanjay Gami, Diego Gris, Gordana Jacimovski, Emma Long, Shona Ort, and Patty Ristow. For questions about these results contact Quirine M. Ketterings at 607-255-3061 or qmk2@cornell.edu. Cornell Nutrient Management Spear Program website: http://nmsp.cals.cornell.edu/.

Cover crop interseeding research in New York

Brian Caldwell1, Chris Pelzer1, and Matthew Ryan1
|1
Soil and Crop Sciences Section – School of Integrated Plant Science, Cornell University

Fig. 1. Paul Stachowski drives the InterSeeder through soybeans at the Cornell Musgrave Research Farm in Aurora, NY.

The InterSeeder is a new tool developed at Penn State University that allows for drilling of cover crops into standing cash crops (Figure 1). At the same time, liquid fertilizer and herbicides can also be applied to reduce the number of tractor passes. Three 7.5”-spaced rows of cover crops are drill interseeded in the space between 30” corn or soybean rows, allowing for excellent establishment of the cover crops. This takes place after the cash crop is established and is no longer susceptible to competition from weeds (i.e., after the critical period for weed control, which is roughly stage V5 for corn and V4 for soybeans (Hall et al. 1992). Compared to being planted after cash crops are harvested in late fall, interseeded cover crops have more time to grow before winter (Figure 2). As corn and soybean begin senescing in late summer, cover crop plants quickly add biomass before winter. In proportion to their growth in the fall and the next spring, cover crops provide a number of benefits such as recycling of nitrogen in the soil, protecting soil from erosion, and adding organic matter.

Fig. 2. Interseeded red clover, crimson clover, and hairy vetch in corn.

Previous research was done in New York State using other methods of interseeding into corn (Scott et al. 1987) and soybeans (Hively and Cox 2001). See also http://mysare.sare.org/wp-content/uploads/917698final.pdf. Results were promising, but problems remained with inconsistent cover crop establishment (Jane Mt. Pleasant, personal communication). Although drilling cover crops with the InterSeeder has potential to increase consistency of establishment so that cover crop benefits are achieved, there are a number of questions about the best way to implement this practice. Optimal seeding dates, cover crop species, varieties, mixtures, and soil nutrient levels have yet to be determined. Here we report on field experiments in NYS over the past two years.

On-farm cover crop interseeding trials

In 2013 and 2014, several trials were conducted in at four on-farm sites and at the Cornell Musgrave Research Farm. Five treatments consisting of two annual ryegrass varieties, tillage radish, a legume mix (hairy vetch, red clover, and crimson clover), and ryegrass + legume mix were interseeded into corn. Roundup Ready corn was used at all locations and glyphosate was applied to control weeds prior to interseeding.

Interseeded tillage radish was grown in two trials only. It produced 100-500 dry lb/acre of biomass in the fall and was killed over the winter. Performance of annual ryegrass and mixes was variable. In general, fall cover crop dry biomass was less than 700 lb/acre. In the following spring, legumes and legume mixes often produced the most biomass. Spring biomass of winter hardy species was influenced by cover crop termination date. Overwintered cover crops in New York typically grow rapidly after May 1 until they begin to reproduce in late May to mid-June. Thus early May termination can result in much lower biomass than that of cover crops terminated in late May or early June. Biomass in the fall reflects the ability of a cover crop to reduce erosion and protect soil over the winter, whereas its biomass in the spring affects soil nutrient levels. For example, depending on management practices and weather conditions, a legume cover crop biomass of 1,000 lb/a in the spring can typically provide 15 lbs/acre of nitrogen to the following crop.

In our trials, yield of the “host” crop (a cash grain crop into which the cover crops were interseeded) was not affected by the presence of an interseeded cover crop, except in one case when the interseeding was done too late and a soybean crop was damaged by equipment. However, the host crop strongly affected the interseeded cover crop. At the Cornell Musgrave Research Farm, legumes produced over 1,500 lb/acre of biomass by May 22, 2014. In contrast, at the Reed Farm in northern New York, all cover crops produced less than 250 lb/acre of biomass by May 13, 2014. Temperatures were cooler at the Reed Farm and cover crop termination was earlier, partially explaining the lower biomass levels. In addition to climate differences, the 2013 Musgrave Farm host corn crop produced less than 100 bu/acre (due to excessive spring rain and poor drainage), whereas the Reed Farm host corn crop yielded twice as much. Cover crop growth at Musgrave Farm in spring 2014 was likely more vigorous because it established under the weaker-growing 2013 host corn. Dense, tall corn such as in the Reed Farm trial, and closed-canopy soybean stands will shade and suppress cover crops interseeded into them, especially under dry conditions.

In 2013, cover crops also performed very well at the Evanick Farm, a dairy where corn was grown for silage instead of grain. Corn was planted on May 4, 2013 and cover crops were interseeded on July 2, 2013. At this site, ‘KB Royal’ annual ryegrass produced over 2,000 lb/acre of fall biomass, sampled on October 30, 2013, and the annual ryegrass + legume mix produced 1,850 lb/acre. The next spring KB Royal, legumes, and the ryegrass/legume mixture each produced about 750 lb/acre by May 1, 2014. On dairy farms such as the Evanick Farm, manure applications may result in relatively large amounts of nitrogen mineralization after silage harvest in mid-September. This, plus the early date of corn silage removal, can allow for high cover crop biomass levels in the fall, and impressive growth in spring before an early termination. Silage yield was moderate and was not affected by the interseeded cover crops.

Comparing interseeded cover crop species in soybean

In 2013, 11 cover crop species and mixes were drill interseeded into soybeans at the Cornell Musgrave Research Farm in Aurora, New York and their performance was compared. Again, Roundup Ready soybeans were planted and glyphosate was applied for weed control prior to cover crop interseeding. Cover crops were drill interseeded into soybeans on July 16, which resulted in good establishment. Soybean yields averaged 53 bu/acre across interseeded cover crop treatments. Fall 2013 cover crop biomass, sampled after soybean harvest on November 19, 2013, was high for crimson clover, the legume mix, perennial ryegrass, cereal rye, and annual ryegrass. Red clover and tillage radish produced intermediate amounts of biomass. Orchardgrass, yellow sweet clover, ladino clover, and Kentucky bluegrass produced a low amount of fall biomass (Figure 3).

Fig. 3. Average dry matter biomass of cover crops interseeded into soybeans at the Cornell Musgrave Research Farm in Aurora NY in 2013. Cover crops were sampled in the fall of 2013 and spring of 2014. Bars represent standard error.

The following spring, several species grew well before termination on May 22, 2014. Cereal rye produced 2,000 lb/acre and medium red clover produced over 1,200 lb/acre. Yellow blossom sweet clover, perennial ryegrass, and orchardgrass also produced around 1,000 lb/acre. Annual ryegrass, Kentucky bluegrass, and ladino clover performed poorly, and winter survival of crimson clover and tillage radish was very low (Figure 3).

In the 2014-15 soybean trial, results were quite different. Weather conditions during the 2014 growing season were more challenging and cover crops were not interseeded until August 11, almost a month later than in 2013. Soybean yields were lower at 38 bu/acre, and again no differences in soybean yield were observed between treatments. Fall 2014 cover crop biomass was visibly much lower than in 2013, but cover crops were not sampled. In spring 2015, annual ryegrass produced the greatest biomass, which was similar to the amount of annual ryegrass produced in the spring of 2014. However, the other cover crop treatments did not perform as well as in the previous year (Figure 4).

Fig. 4. Average dry matter biomass of cover crops interseeded into soybean at the Cornell Musgrave Research Farm in Aurora NY in 2014. Cover crops were sampled in spring of 2015. Bars represent standard error.

Interseeding cover crops into soybeans has potential, but this practice needs more research. We observed that earlier-seeded cover crops could establish well and produce more fall and spring biomass than later-seeded cover crops, without impacting soybean yield. In both years of the experiment, red clover, orchardgrass, and the ryegrass treatments were among the top producers of biomass.

Conclusions

Interseeding cover crops into corn and soybeans can be a successful strategy to improve cover crop performance without decreasing host cash crop yields. Despite variable results, our findings indicate that: 1) interseeding cover crops too late can reduce cover crop establishment and limit biomass production; and 2) delaying cover crop termination until the second half of May can increase biomass production substantially. Interseeding cover crops in silage corn (rather than grain corn) results in better cover crop growth because corn silage is harvested earlier than corn grain, thus allowing for unobstructed cover crop growth for about an extra month in the fall.

We suggest that a reasonable interseeding program may be to establish a mixed ryegrass and legume cover crop under soybeans before next year’s corn; or ryegrass alone under corn before next year’s soybeans. Cover crops should produce a fall biomass of 200 to 500 lb/acre and protect the soil over winter. The following spring, delaying cash crop planting until late May can allow production of 2000 lb/acre cover crop biomass. Increased duration of spring cover crop growth could increase nitrogen content of biomass to 60 lb N/acre, in addition to cycling other nutrients and adding organic matter to the soil. There would likely be a minor 2nd year corn yield loss with this approach due to late planting date, but this could be offset by a reduction in corn nitrogen fertilization costs. Research is needed to better understand tradeoffs with yield potential and fertilizer costs associated with delaying cover crop termination in the spring.

The InterSeeder was designed by Bill Curran, Corey Dillon, Chris Houser, and Greg Roth at Penn State and they have developed additional guidelines and herbicide recommendations for cover crop interseeding. For more information about this practice and the InterSeeder see:

  1. http://extension.psu.edu/plants/crops/soil-management/cover-crops/interseeder-applicator/improving-the-success-of-interseeding-cover-crops-in-corn
  2. http://www.interseedertech.com/

This work was supported by a joint research and extension program funded by the Cornell University Agricultural Experiment Station (Hatch funds) and Cornell Cooperative Extension (Smith Lever funds) received from the National Institutes for Food and Agriculture (NIFA) U.S. Department of Agriculture (Project: 2013-14-425). Partial support was also provided by the Northern New York Agriculture Development Program (Project: The early interseeded cover crop gets the worm) and the USDA NRCS CIG program (Project: Maximizing conservation in the Chesapeake Bay Watershed with an innovative new 3-way interseeder for early establishment of cover crops in no-till corn and soybean). Any opinions, findings, conclusions, or recommendations expressed in this publication are those of the authors and do not necessarily reflect the view of the U.S. Department of Agriculture.

References
Hall, M.R., C.J. Swanton, and G.W. Anderson. 1992. The Critical Period of Weed Control in Grain Corn. Weed Science. 40:441-447.

Hively, W. D. and W. J. Cox. 2001. Interseeding Cover Crops into Soybean and Subsequent Corn Yields. Agron. J. 93:308–313.

Scott, T. W., J. Mt. Pleasant, R. F. Burt, and D. J. Otis. 1987. Contributions of Ground Cover, Dry Matter, and Nitrogen from Intercrops and Cover Crops in a Corn Polyculture System. Agron. J. 79:792-798.