Melanie Soberon1, Sebastian Cela1, Quirine Ketterings1, Caroline Rasmussen1, Karl Czymmek1,2
1Cornell University Nutrient Management Spear Program, 2PRODAIRY
A review: The whole farm nutrient mass balance assessment
In an adaptive management approach for whole farm nutrient management, records are kept in such a way that one can assess the nutrient status of the whole farm, pinpoint the areas where improvements can be made, and then track the progress of those improvements from year to year. In a previous issue of What’s Cropping Up? (Soberon et al., 2015), the concept of assessing the nutrient mass balance (NMB) for nitrogen (N), phosphorus (P) and potassium (K) on a whole farm was described. A follow-up study examining feasible whole farm NMBs using data from one year (2006) for 102 dairy farms from 26 different New York counties showed a wide range in farm balances (-35 to 211 lbs N/acre, -7 to 45 lbs P/acre, and from -45 to 132 lbs K/acre) (Cela et al., 2015). This work also resulted in the establishment of feasible balances, based on what 75% of the farmers were able to achieve: ≤105 lbs N/acre, ≤12 lbs P/acre, and ≤37 lbs K/acre and defined a “feasible” NMB per cwt of milk produced as those at or below which 50% of the dairies were operating in 2006: ≤0.88 lbs N/cwt, ≤0.11 lbs P/cwt, and ≤0.30 lbs K/cwt. The “optimum operational zone” was described where farms are operating below the feasible NMBs per acre and per cwt (Cela et al., 2015). To generate a clear understanding of the specific management changes that result in long-term, sustainable solutions over time in a farm’s nutrient status, NMB assessments must be examined over multiple years.
Tracking nutrient mass balances over time on 54 New York dairy farms
In this study, we analyzed data from 54 New York dairy farms that conducted annual NMB assessments for 4 to 6 years between 2005 and 2010. There was a range of farm sizes in the dataset; 42 had less than 200 cows and were classified as animal feeding operations (AFOs), and twelve exceeded 200 cows and were classified as concentrated animal feeding operations (CAFOs) based on New York thresholds at that time. On average over the first two years (initial assessment), AFOs reported lower animal densities than CAFOs (0.53 vs 1.06 AU/acre, respectively), lower milk production per cow (18,609 lbs vs 23,202 lbs/cow/yr, respectively), and a higher percentage of homegrown feed (77 vs 68%, respectively). Whereas, feed use efficiencies were higher for CAFOs (22, 28, and 11% for N, P, and K, respectively) than for AFOs (16, 21, and 7% for N, P, and K, respectively).
Fig. 1. Average N, P, and K balances (lbs/acre) and milk production per cow (1000 lbs/cow/yr) in the beginning and the end of the study, for AFOs and CAFOs.
In the beginning of the study, NMB per acre averaged 67 lbs N/acre, 10 lbs P/acre, and 30 lbs K/acre across the 54 farms. Seventy-four, 76, and 63% of the farms reduced the N, P, and K balances per acre over time, and 55 to 61% of these farms were able to simultaneously increase milk production per cow (Fig. 1). The overall change in NMB per acre averaged -20 lb/acre for N (29% reduction), -3.6 lbs P/acre (36% reduction), and -9 lbs K/acre (29% reduction). After four to six years of annual NMB assessments and monitoring (final assessment), the average balances for the 54 farms decreased to 47 lbs N/acre, 6 lbs P/acre, and 21 lbs K/acre. Over time, farms with the highest initial NMB exhibited the most drastic reductions in NMB, while farms that had low or negative initial NMB tended to increase them over time. Because the ideal NMB is farm-specific, but slightly positive, these results indicate that farms made changes in NMB that were directionally correct.
Comparison with the previously established feasible NMB benchmarks
Initially, 36 of the 42 small farms (86%) and 5 of 12 medium and large farms (42%) operated with N balances per acre below the feasible benchmarks proposed for NY dairies by Cela et al. (2015). The percentage of AFOs versus CAFOs operating below the benchmark values after 4 to 6 years increased to 93 and 50%, respectively. The largest increase in the percentage of farms meeting the feasible P and K balances was observed in the CAFOs, which increased from 42 and 25% in the initial assessment years, to 75 and 50% in the final NMB assessments, respectively (Fig 2).
Fig. 2. Number (and percentage) of AFOs and CAFOs with feasible NMB (lbs/acre) in the initial and final assessment.
What were the main drivers of change?
The single largest driver of change in N and P balances among the 54 farms was a change in imported feed. The largest drivers of change in K balances were the amount of feed and fertilizer purchased (Fig. 3).
Fig. 3. Average reduction in N, P and K imported through feed and fertilizer (lbs/acre) across all farms over the study period.
After 4 to 6 years of NMB assessment, the average nutrients imported through feed changed by -10.4 lb N/acre, -1.7 lb P/acre and -3.8 lb K/acre (Fig. 3). Similarly, the average nutrients imported through fertilizer changed by -3.8 lbs N/acre, -0.9 lbs P/acre and –2.1 lbs K/acre (Fig. 3). Reduced feed imports can be achieved through a variety or combination of different management practices including increasing the amount of homegrown feed and feed use efficiency, and implementation of precision feeding.
In summary
New York dairy farms reduced their NMBs over time while maintaining or increasing milk production per cow. While change in feed imports was the most important driver for change in N and P balances across farms, adjustments in both feed and fertilizer imports affected K balances. Farmers were able to improve their farm’s balance by making changes in total nutrient imports, feed imports, animal density, percentage of farm-produced feed and nutrients, and feed nutrient use efficiency, highlighting the opportunities of an adaptive management approach that includes NMB assessments to evaluate and monitor changes in nutrient use efficiency over time.
Literature cited
Soberon, M.A., Q.M. Ketterings, K.J. Czymmek, S. Cela, and C. Rasmussen (2015). Whole farm nutrient balance calculator for New York dairy farms. What’s Cropping Up? 25(2).
Cela, S., Q.M. Ketterings, K.J. Czymmek, M.A. Soberon, C.N. Rasmussen (2015). Feasible whole farm nutrient mass balances for New York dairy farms. What’s Cropping Up? 25(2).
Additional resources
Soberon, M.A., S. Cela, Q.M. Ketterings, C.N. Rasmussen, and K.J. Czymmek. 2015. Changes in Nutrient Mass Balances over time and related drivers for 54 New York dairy farms. J. Dairy Sci. (in press).
Cela, S., Q. Ketterings, K. Czymmek, M. Soberon, and C. Rasmussen. 2014. Characterization of nitrogen, phosphorus, and potassium mass balances of dairy farms in New York State. J. Dairy Sci. 97:1-19.
Soberon, M.A., Q.M. Ketterings, C.N. Rasmussen, and K.J. Czymmek. 2013. Whole Farm Nutrient Balance Calculator for New York Dairy Farms. Nat. Sci. Educ. 42:57–67.
Acknowledgments Thanks to all the farmers, consultants, SWCD and NRCS staff, and Cornell Cooperative Extension educators that participated in this study. Thanks also to Françoise Vermeylen from the Cornell University Statistical Consulting Unit for statistical advice. This work was supported by grants from the Northern New York Agricultural Development Program (NNYADP), Northeast Sustainable Agriculture Research and Extension (NESARE), Federal-Formula Funds, and a USDA-NRCS Conservation Innovation Grant. For questions about these results contact Quirine M. Ketterings at 607-255-3061 or qmk2@cornell.edu, and/or visit the Cornell Nutrient Management Spear Program website at: http://nmsp.cals.cornell.edu/.
Sebastian Cela1, Quirine Ketterings1, Karl Czymmek1,2, Melanie Soberon1, Caroline Rasmussen1
1Cornell University Nutrient Management Spear Program, 2PRODAIRY
Monitoring the nutrient status of dairy farms
A nutrient mass balance (NMB) is a useful tool to characterize the nutrient status of dairy farms (Soberon et al., 2013). The tool is most effective when farmers assess NMBs over several years. Such long-term trends allow farmers to evaluate the impact that specific management changes have had on the farm’s nutrient use efficiency, milk production, and potential for nutrient loss.
Feasible nutrient mass balances for New York
A previous What’s Cropping Up? article (Cela et al., 2015) reported a large range of NMBs per acre and per hundredweight (cwt) of milk across 102 dairy farms in New York. This study explored “feasible” NMBs for high-producing New York dairies as <105 lbs N/acre and <12 lbs P/acre, while the suggested targets per cwt were <0.88 lbs N/cwt and <0.11 lbs P/cwt. This information was obtained from NMBs on a single year (2006) and resulted in the definition of an “optimum operational zone” (operating below the feasible NMBs per acre and per cwt). A follow-up study (Soberon et al., 2015) reported that 63 to 96% of 54 New York dairy farms reduced NMB per acre over 4 to 6 years, and 55 to 61% of these farms simultaneously increased milk production per cow. In the current study, we evaluated if high-producing farms were able to consistently operate in the optimal operational zone and maintain or increase milk production over time.
Can dairy farms consistently operate with feasible mass balances?
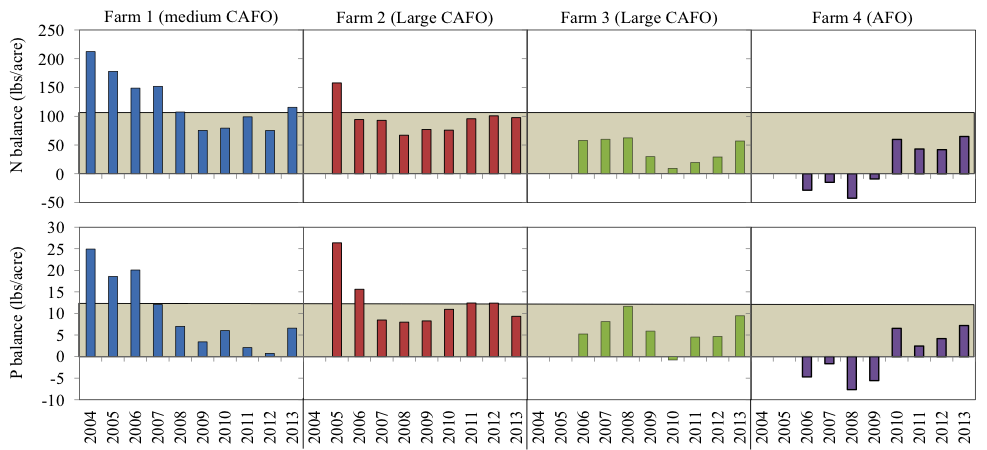
Here we present the results of four dairy farms that assessed NMB over 8 to 10 years. Two of these farms decreased NMBs per acre and per cwt over time, a third farm always operated below the feasible balances suggested for New York, and the fourth farm increased NMBs over time (Fig. 1). Farmers made changes in NMBs that were directionally correct; the two farms that initially exceeded NMBs reduced them over time, whereas the farm that started with negative NMBs tended to increase its NMB (Fig. 1).
Fig. 1: Trends of N and P mass balances (lbs/acre) for 4 dairy farms in New York. The gray background area shows the feasible balances for NY dairies based on Cela et al. (2014).
Can farms improve nutrient mass balances while increasing milk production?
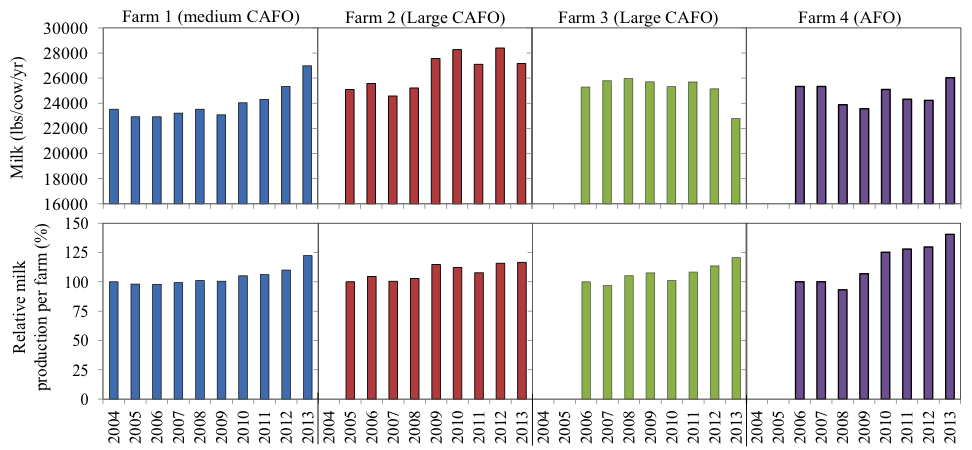
The four dairies increased their total milk production over time (Fig. 2) and had higher milk production per cow than the average of New York (~20,000 lbs of milk/cow per year). Milk per cow increased over time in farms 1 and 2, and was constant in farms 3 and 4 (Fig. 2). The exception was the last year for one of the large CAFOs (Farm 3). In this farm, milk production per cow was lower in 2013 reflecting discontinuation of the use of the rBST hormone. This 4-farm study shows that it is possible for high-producing dairy farms to consistently operate with NMBs per acre and per cwt within the feasible levels while maintaining or increasing milk production.
Fig. 2. Trends of milk productions per cow, and relative milk production per farm (% of the first year), for 4 dairy farms in New York.
Specific management changes
Fig. 3: Farms inside and outside the optimal operational zone (green area) in the first and last 3 years of the study.
Farmers made the largest changes on feed imports. Nutritionists formulated diets closer to animal requirements, resulting in a reduction in concentration of crude protein and P in the purchased feed over time. This was often achieved by reducing purchases of concentrates such as cottonseed, canola meal, and soybean meal, and replacing them these feed ingredients with blends with a lower nutrient concentration. This highlights the importance of precision feeding to improve NMBs. Other changes included reducing N fertilizer by eliminating starter N for corn for one of the farms, and reducing P fertilization by changing the corn starter blend from “20-20-0” (N-P2O5-K2O) to “5-0-8” on another farm. Changes in nutrient exports were usually small. Farms with low animal densities could export crops and this reduced the NMB. Farms with high animal densities (>1 AU/acre, or about 2 acres per cow + replacement) also exported manure, reducing the NMB. We did not measure economic indicators, but farmers made the changes on their own, and milk production remained the same or increased, reflecting win-win scenarios. As a result of these changes, all four dairies were able to operate in the optimum operational zone over the last years (Fig. 3).
We conclude that high-producing dairy farms in New York can consistently operate in the optimal operational zone (feasible NMB per acre and per cwt) and maintain or increase milk production over time. Annual NMBs can help identify if improvements can be made and be used to monitor the impact of management change on whole farm nutrient use efficiency over time.
Literature cited
Cela, S., Q.M. Ketterings, K.J. Czymmek, M.A. Soberon, C.N. Rasmussen (2015). Feasible whole farm nutrient mass balances for New York dairy farms. What’s Cropping Up? 25(2).
Soberon, M.A., S. Cela, Q.M. Ketterings, C. Rasmussen, and K.J. Czymmek. (2015a). Change in nutrient mass balances over time for 54 New York dairy farms. What’s Cropping Up? 25(3).
Soberon, M.A., Q.M. Ketterings, K.J. Czymmek, S. Cela, and C. Rasmussen (2015b). Whole farm nutrient balance calculator for New York dairy farms. What’s Cropping Up? 25(2).
Additional resources
Cela, S., Q. Ketterings, K. Czymmek, M. Soberon, and C.N Rasmussen. 2014. Characterization of nitrogen, phosphorus, and potassium mass balances of dairy farms in New York State. J. Dairy Sci. 97:1-19.
Soberon, M.A., S. Cela, Q.M. Ketterings, C.N. Rasmussen, and K.J. Czymmek. 2015. Changes in Nutrient Mass Balances over time and related drivers for 54 New York dairy farms. J. Dairy Sci. (in press).
Soberon, M.A., Q.M. Ketterings, C.N. Rasmussen, and K.J. Czymmek. 2013. Whole Farm Nutrient Balance Calculator for New York Dairy Farms. Nat. Sci. Educ. 42:57–67.
Acknowledgments Thanks to all the farmers, consultants, SWCD and NRCS staff, and Cornell Cooperative Extension educators that participated in this study. Thanks also to Françoise Vermeylen from the Cornell University Statistical Consulting Unit for statistical advice. This work was supported by grants from the Northern New York Agricultural Development Program (NNYADP), Northeast Sustainable Agriculture Research and Extension (NESARE), Federal-Formula Funds, and a USDA-NRCS Conservation Innovation Grant. For questions about these results contact Quirine M. Ketterings at 607-255-3061 or qmk2@cornell.edu, and/or visit the Cornell Nutrient Management Spear Program website at: http://nmsp.cals.cornell.edu/.
Bill Cox, Eric Sandsted, and Phil Atkins Soil and Crop Sciences Section, Horticulture Section, NY State Seed Improvement Project – Plant Breeding and Genetics Section; School of Integrative Plant Science, Cornell University
We initiated a 3-year study at the Aurora Research Farm in 2015 comparing the corn, soybean, and wheat/red clover rotation under conventional and organic cropping systems during the 3-year transition period (2015-2017) from a conventional to an organic cropping system. We used three entry points or previous crops to initiate the study: 1) small grain, 2) grain corn, and 3) soybean experimental areas in 2014. Two of the many objectives of the study are to determine the best previous crop and the best crop to plant in the first year of the transition from conventional to organic cropping systems. Both cropping systems are being compared under recommended and high inputs (high seeding and N rates, and fungicide under high input in conventional; high seeding and N rates and seed treatment under high input in organic).
We planted corn and soybean on May 23 after mold-plowing on May 22 and culti-mulching the experimental areas on the morning of planting. We planted the treated GMO corn hybrid, P96AMXT, in the conventional plots; and the isoline, untreated non-GMO, P9675, in the organic cropping systems at two seeding rates, ~30,000 and 35,000 kernels/acre. In the organic cropping system, we also treated P9675 in the seed hopper with Sabrex, an organic seed treatment with Tricoderma strains in the high input treatment. We used a White Air Seeder to plant both hybrids.
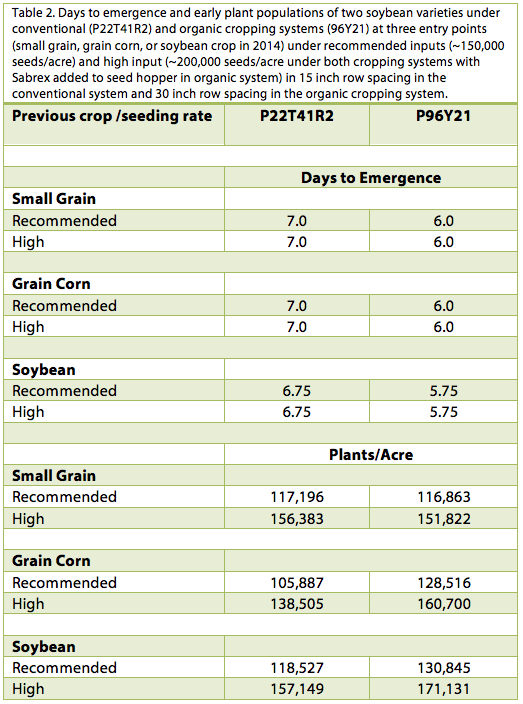
We also used the White Air Seeder to plant the treated GMO soybean variety, P22T41R2, and the non-treated non-GMO, 92Y21, at two seeding rates, ~150,000 and 200,000 seeds/acre. As with corn, we treated 92Y21 in the seed hopper with the organic seed treatment, Sabrex, in the high input treatment (high seeding rate). Unlike corn, however, we used different row spacing in the two cropping systems with the typical 15” row spacing in the conventional cropping system and the typical 30” row spacing (for cultivation of weeds) in the organic cropping system. Consequently, in comparing days to emergence and the early plant populations of the two crops under two cropping systems, the soybean comparison is not as robust as the corn comparison because of the different row spacing and genetics between soybean varieties in the two cropping systems.
Weather conditions were warm and dry for the first 7 days after planting. Corn emergence (50% of the plants emerged) varied between conventional and organic cropping systems but not between inputs within a cropping system (Sabrex in the high input organic cropping system). For all three entry points (previous crop), corn emergence in the conventional cropping system occurred earlier in the conventional cropping system, including 1 day earlier in the small grain entry point (Table 1).
Weed densities were very low following all previous crops but some weeds were observed in the “white thread’ stage (just germinating below the soil surface) following grain corn so we estimated early plant populations in all treatments on June 4th in the corn entry point before tine weeding in the organic cropping system on June 5th. Most but not all of the corn was up so these plant populations are preliminary. We will estimate plant populations again after the last cultivation in the organic cropping system and again just before harvest. Nevertheless, corn plant populations in the conventional vs. organic cropping system were ~1000 plants/acre higher at the recommended seeding rate (~30,000 kernels/acre) and more than 3000 plants/acre higher at the higher seeding rate (Table 10. The hybrid, P9675, had ~85% early emergence with or without Sabrex. Again, these are preliminary counts but more corn plants got out of the ground faster in the conventional compared with the organic cropping system. It is not clear whether the GMO traits (Bt root worm, etc.) or seed treatment (fungicide and insecticide) contributed to the differences.
In contrast, soybean emergence was consistently 1 day earlier in the organic vs. the conventional cropping system for all three entry points (Table 2). We took early stand counts for all three entry points on June 4 because we planned to tine weed all the soybean plots on June 5 (but only tine-weeded the organic soybeans in the grain corn plots). The variety, P96Y21, in the organic cropping system had greater plant populations compared with P22T41R2, when following grain corn and soybeans but not following a small grain. It is not clear why there was a difference between the two cropping systems when following soybeans and grain corn but not thesmall grain. Likewise, it is not completely clear why P92Y21 emerged earlier than P22T41R2 but P92Y21 did have a higher field emergence score (8 on the Pioneer 1-10 scale) compared with P22T41R2 (7 score). The varieties were also planted in different row spacing in the conventional (P22T41R2 in 15 inch rows) and organic cropping system (P92Y21 in 30 inch rows), which may have allowed the organic soybean treatment to “work together” in the thickly planted row to emerge quickly. As in corn, Sabrex seed treatment in the organic cropping system did not hasten days to emergence nor significantly affect % early stand establishment. Again, these are preliminary plant population estimates but more soybean plants got out of the ground faster in the organic compared with the conventional cropping system when grain corn and soybeans were the entry points in the transition to organic cropping systems.
In conclusion, corn emerged earlier in conventional compared with the organic cropping system. About 1000 more plants/acre in the conventional vs the organic cropping system were estimated 12 days after planting when grain corn was the entry point or previous crop in 2014. We will estimate corn populations again after the last cultivation in the organic cropping system and again just before harvest. It is not clear if the early emergence and higher early plant populations were associated with the GMO trait (Bt rootworm) or seed treatment (fungicide and insecticide).
In contrast, soybean emergence was more rapid in the organic compared with the conventional cropping system at all three entry points, perhaps because the variety (96Y75) had a higher field emergence score compared with P22T41R2. Likewise, early plant populations before tine weeding were higher in the organic cropping system compared with the conventional cropping system in the soybean and grain corn entry points but not in the small grain entry point. Again, these are preliminary estimates and we will estimate soybean populations just before the first cultivation and again just before harvest.
Quirine M. Ketterings1, Shona Ort1, Sheryl N. Swink1, Greg Godwin1, Tom Kilcer1, Jeff Miller2, Bill Verbeten3, and Karl J. Czymmek4
1Nutrient Management Spear Program, Department of Animal Science, Cornell University, Ithaca, New York, 2Cornell Cooperative Extension of Oneida County, 3Northwest New York Dairy, Livestock, and Field Crops Extension Team, 4PRODAIRY, Cornell University
Double Crops in Corn Rotations
Weather extremes in 2012 and 2013 impacted corn silage and hay yields for many dairy farms in New York, prompting a growing interest in double cropping of winter cereals for harvest as high quality forage in the spring. In 2012‒2014, forage yields were measured on farms for cereal rye and triticale to document yield potentials and expected yields for these winter forages grown in corn-cereal rotations in New York. We also interviewed 30 New York farm managers who grew winter cereals as double crops with corn silage in 2013 to learn from their experiences.
Yield Averages and Ranges
The study included 19 cereal rye fields and 44 triticale fields. Averaged over the three years, cereal rye yielded 1.62 tons DM/acre (nineteen fields) with an average minimum yield of 0.99 tons DM/acre and maximum of 2.40 tons DM/acre (Table 1; Figure 1). The average triticale yield over the 3-year period amounted to 2.18 tons DM/acre (44 fields) with an average minimum yield of 1.06 tons DM/acre and maximum of 3.46 tons DM/acre (Table 1; Figure 1). No side-by-side comparisons were done between the two species so we cannot conclude if one species yielded higher than the other in any of the years. But, the results show that yields exceeding 1 ton DM/acre are common (Figure 1); 71% of all fields exceeded 1.5 tons DM/acre. Determining the factors that enable higher yields (3 to 4 tons DM/acre) on some fields (Figure 1) will be essential to increase farmer adoption of double cropping with small grain cereal crops.
Fig. 1. Distribution of yields of 19 cereal rye and 44 triticale fields harvested as forage in May of 2012-2014 in New York.
Farmer Survey
Of all farm tillable acres among the 30 farms, 3768 acres (8%) were double cropped with a winter cereal harvested as forage in May. For 14 (47%) of the 30 farmers in the survey, 2013 was the first year of growing double crops on the farm. Nine farmers (30%) had 2‒4 years of experience. Three farmers (10%) had 5‒7 years of experience while four farmers (13%) had implemented double cropping for more than 10 years. Of all farmers in the survey, 25 (83%) had tried triticale as a double crop while 14 (47%) had experience with cereal rye. Seeding rates ranged from 60 to 185 lbs seed/acre for triticale and from 60 to 150 lbs seed/acre for cereal rye. Fields were established with drills (57%) or broadcast-seeded (43%), and 37% received manure in rates ranging from 2,500 to 12,000 gallons of manure/acre. Fertilizer was used at green-up by 79% of the farmers. The most commonly applied fertilizers were urea or urea mixed with ammonium sulfate (48% of the farmers). Ten farmers (34%) used liquid urea ammonium nitrate with or without ammonium thiosulfate; the remaining farmers did not identify the source of N they used. Nitrogen application rates varied from zero (21% of all farms) to 40‒50 lbs N/acre (21%), 50‒70 lbs N/acre (29%), 70‒80 lbs N/acre (18%), and a high of 80‒105 lbs N/acre (11% of the farms). The average application rate for those farmers who applied N was 66 lbs N/acre with a median of 60 lbs N/acre. The wide range in N application rates might reflect, among others, the lack of knowledge about and guidance for N management for these winter cereals grown as forage crops in corn rotations. Herbicide was applied to the double crops grown as forage in 2013 by only three of the 29 farmers (10%) who responded to this question. None of the farmers indicated use of fungicides or insecticides for the winter cereals. This is not surprising as harvest takes place prior to the onset of common diseases and pests for winter cereals in the Northeast.
Farmer Motivation for Double Crop
Sixteen farmers (53%) listed the desire to increase the forage production on a limited crop area as the main reason for seeding winter cereals. Ten (33%) indicated they had seeded double crops to address a feed shortage (emergency feed). Increased farm profits and higher quality feed were listed as reasons for including double crops by five (17%) and four (13%) of the farmers, respectively. Of all farmers, 25 farmers (83%) planned to continue to grow winter cereals as a forage crop in the future, with an additional five farmers (17%) who said they might consider it. In total, sixteen farmers (53%) planned to increase the acreage planted to double crops in the coming year, while another seven (23%) said they may do so but were not sure yet.
Challenges and Information Needs
The biggest challenge with the double crop rotation identified by the farmers was getting a double crop seeded in time in the fall (Table 2), consistent with the short period between corn silage harvest and first frost. In addition, nine farmers (32%) pointed to the potential for delay in corn planting following double crop harvest. Five farmers (18%) identified labor and time involved as a constraint, while four farmers (14%) pointed to weather challenges during harvest time of the double crops (too wet in spring to get equipment on fields). Many farmers identified the impact of the double crop on the following crop as the most important aspect of double cropping that they needed to learn more about. They wanted to know more about the impact of nutrient uptake and removal by the double crop harvest on fertilizer needs of the crop seeded after double crop harvest. This was followed by questions about economics and forage quality (milk production potential of the winter cereals), and harvest methods.
Conclusions
Yields averaged 1.62 and 2.18 tons DM/acre for cereal rye and triticale, respectively, and 71% of all fields exceeded 1.5 tons DM/acre. Surveyed farmers planted, on average, 8% of their tillable acres to winter cereal with the intent to harvest as forage. Triticale was the most frequently used (70%), typically seeded with a drill (57%). Manure was applied to 37% of the fields. Fertilizer N was applied at dormancy break by 79% of the farmers, with a median application rate of 60 lbs N/acre. The biggest challenge with the double-crop rotation, identified by the farmers, was timely seeding of the double crop in the fall. Despite challenges encountered and questions about the impact of harvest of the winter cereal on the main crop, 83% of the surveyed farmers planned to continue to grow double crops. This study shows New York farmers successfully implemented corn-winter cereal double cropping practices, benefitting agricultural environmental management and per acre forage production. Economic analyses need to be conducted to evaluate what yield level is needed for a positive economic return on investment.
Additional Resource
Ketterings, Q.M., S. Ort, S.N. Swink, G. Godwin, T. Kilcer, J. Miller, W. Verbeten, and K.J. Czymmek (2014). Winter cereals as double crops in corn rotations on New York dairy farms. Journal of Agricultural Science –DOI: 10.5539/jas.v7n2p18.
Acknowledgments
Funding sources included the Northern New York Agriculture Development Program (NNYADP), a USDA-NRCS Conservation Innovation Grant, and Federal Formula Funds. We thank Cornell Cooperative Extension field crop educators Paul Cerosaletti, Janice Degni, Dale Dewing, Kevin Ganoe, Mike Hunter, Jeff Miller, and Ashley Pierce; crop consultants Pete Barney, Eric Bever, Jeremy Langner, Joe Lawrence, and Jeff Williard; Soil and Water Conservation District staff Jonathan Barter, Steve Lorraine, and Aaron Ristow; and Natural Resources Conservation Service staff Paul Salon and Martin Van Der Grinten for their collaboration. We thank the many participating farmers for hosting trials and completing the surveys and Lars Demander, Sanjay Gami, Diego Gris, Gordana Jacimovski, and Emma Long of the Nutrient Management Spear Program at Cornell University for help with field data collection and sample processing. For questions about these results contact Quirine M. Ketterings at 607-255-3061 or qmk2@cornell.edu, and/or visit the Cornell Nutrient Management Spear Program website at: http://nmsp.cals.cornell.edu/.
New York farmers know the challenges of growing grains on the highly varied soils of the State. Extreme changes in moisture, fertility, elevation, and acidity within a single field can make management decisions challenging for producers. The NYCSGA has set out on a mission to make these decisions easier for our producers by utilizing the technologies available on most modern equipment.
Fig. 1. A 70 acre research field is harvested in Clyde, NY
Recent technologies such as split and variable rate planters, tractor mounted GPS, and yield monitors have given producers the ability to collect an extensive amount of information about their fields and crops. Until now, the research to utilize these data has lagged behind the rapidly developing technologies.
NYCSGA has partnered with several other organizations and companies including Pioneer, Cornell, and New York Farm Viability Institute to conduct this research here in New York. This research will focus around variable rate seeding, hybrid/variety selection, and their performance based on field soil properties. We are working closely with Cornell to develop a predictive model for New York State growers. The model will allow growers to select hybrids and create variable rate seeding prescriptions based on field specific soil properties, climate, and terrain.
To create this model, we are depending on grower participation to build the data set from. In the first two years of the project we have collected field scale trial data from over 2700 acres. In this coming season we aim to meet and exceed these numbers. Increased acreage allows for a more accurate representation of the interaction between environment, hybrid/variety selection, and seeding rate across the State. This analysis is crucial to utilizing agricultural technologies to increase crop performance and thus, producer profit.
Fig. 2. Example of an experimental variable rate seeding prescription in corn (ksds/ac).
Producers who choose to participate will work with the NYCSGA’s Research Coordinator to create a variable rate seeding prescription for all fields involved in the experiment (Figure 2). After the producer plants and harvests the crop, the data is downloaded from displays by a research assistant and used for analysis. During the growing season, the crops will be monitored by the assistant to validate populations as well as scout for pest, disease, or water pressures. Other data such as elevation, soil classification, and soil fertility properties are also collected throughout the season.
The NYCSGA aims to work with the agricultural community and further develop this research into long-term benefits for the State. Producer participation is crucial to the continuation of these investigations. As we think ahead to the 2016 season, we are seeking more producer participants. If you are interested in becoming involved or would like the full report, please contact Savanna Crossman at (802) 393-0709 or savanna@nycornsoy.com.