New Weekly Unemployment Insurance Claims are Rising Again
25 September 2020
When we last reported on new weekly unemployment insurance (UI) claims in New York State back in mid-June, the news was mixed. On one hand, new UI claims had just dropped below 100,000 per week for the first time in two months, where they’ve remained ever since. On the other hand, after falling for two consecutive weeks in late May – the first time the State recorded a back-to-back drop during the pandemic – the number of new claims jumped again in early June. For several weeks after that point, changes in weekly UI claims in New York mirrored national trends. Namely, despite some up and down fluctuations, claims mostly followed a slow, downward trajectory from mid-June through early August:
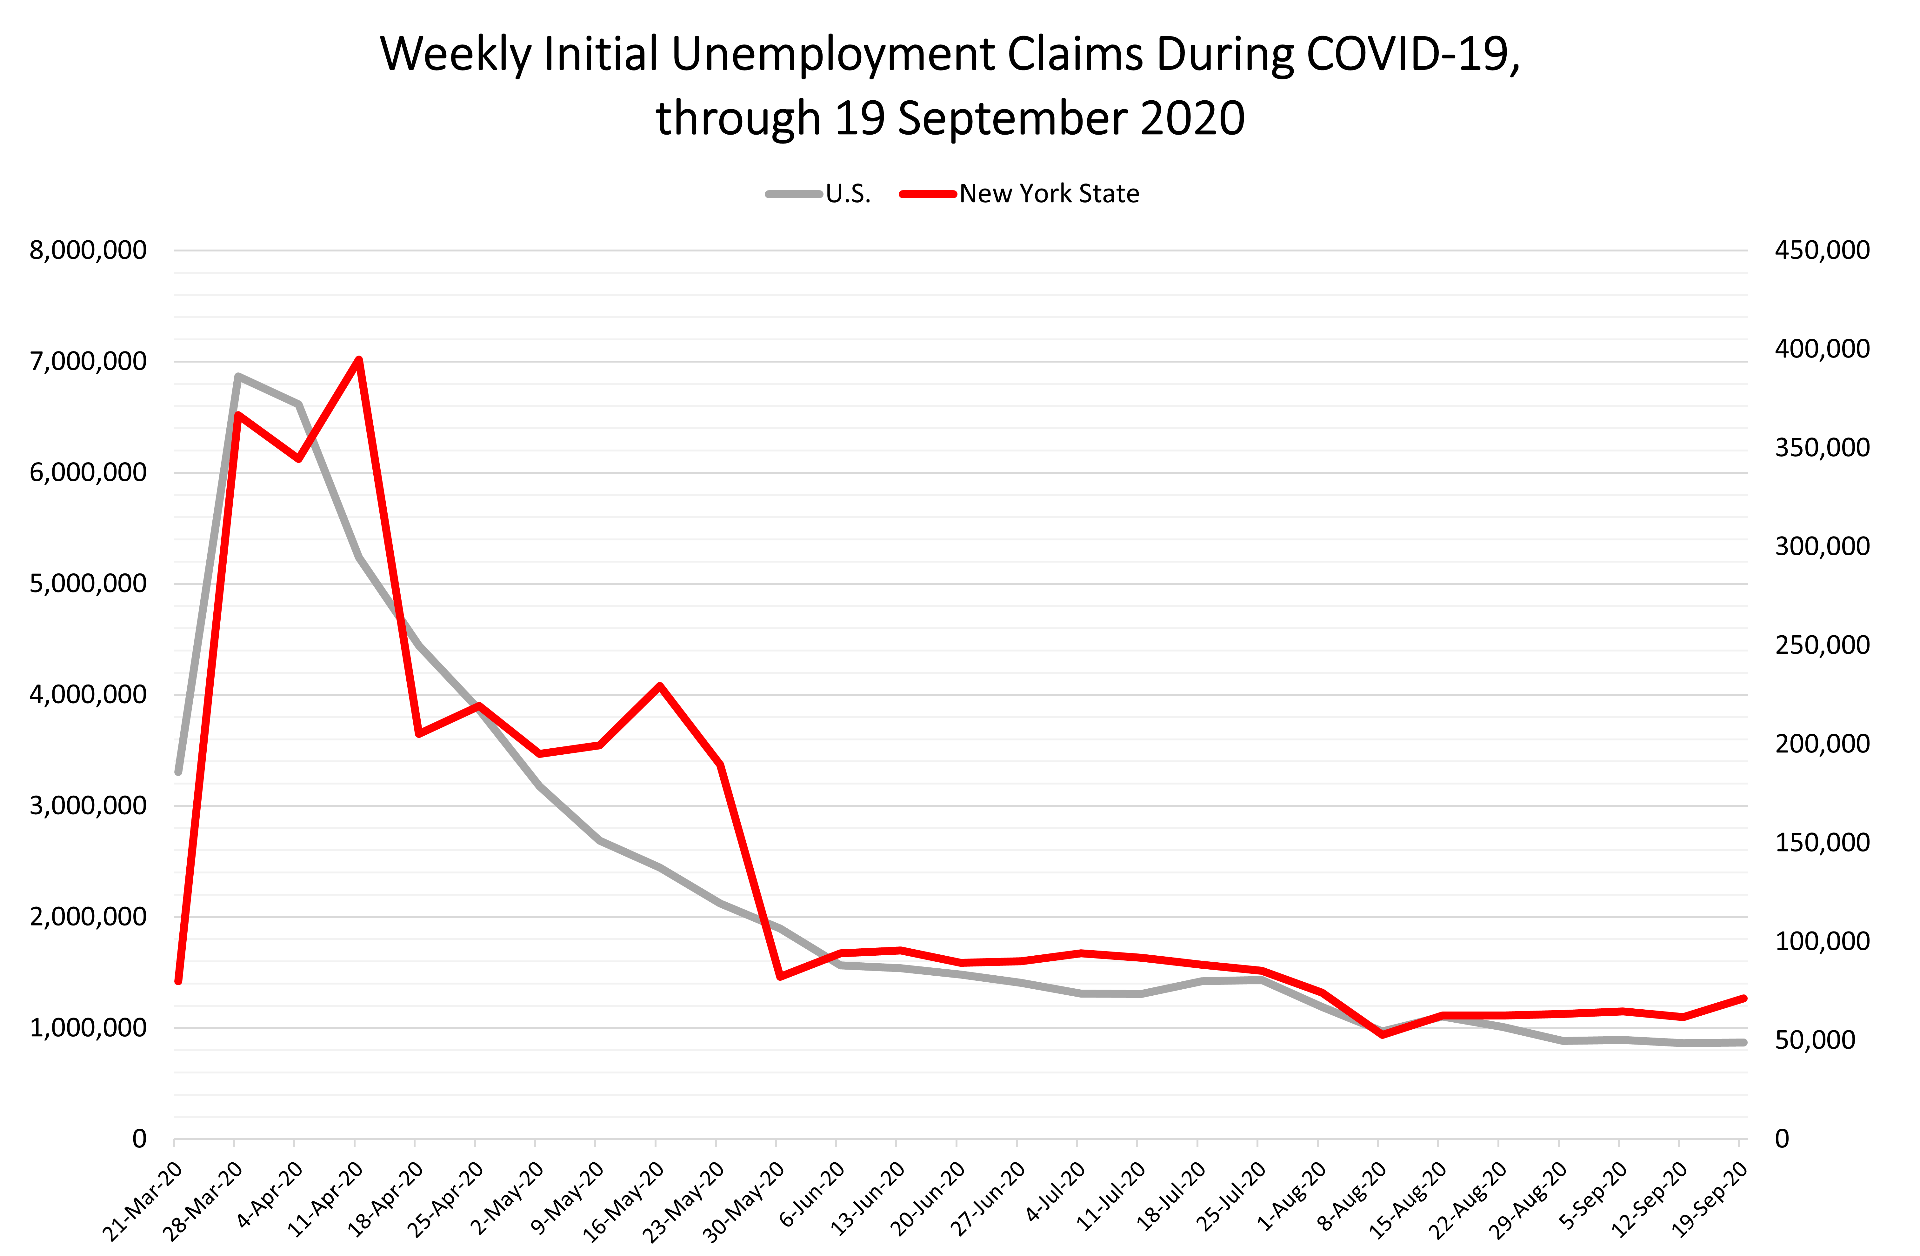
It’s what’s been happening since early August that’s concerning, however. As implicated in the figure above, after reaching an in-pandemic low point during the first week in August – when there were just under 53,000 claims statewide – new UI claims have once again been trending up in New York State. Indeed, for the five weeks that followed this “minimum” value (keep in mind that a “minimum” of 53,000 new claims is still nearly four times higher than the roughly 14,000 statewide claims made in the week prior to the onset of the pandemic), the number of new claims across the State rose to roughly 63,000 per week. Even more troubling, yesterday’s news release from the U.S. Department of Labor reported another 71,000-plus new UI claims in New York for the week ending 19 September 2020 – a 15% increase over the prior week. Nearly all industries were affected, with some of the largest losses occurring in Accommodation and Food Services, Health Care and Social Assistance, and Retail Trade – the same industries that were hit hardest during the initial statewide economic pause.
While the number of new weekly claims was also up nationally (by a factor of about 4,000 in all), the surge in New York was far greater than the national average. This is consistent with numerous other indicators that show New York has been among the states hit hardest by the pandemic. To be sure, the national unemployment rate for August 2020 was down to 8.4 percent. For New York, the rate was 12.5 percent – more than four percentage points higher than the national average, and higher than in all but two states (Rhode Island and Nevada). The large spike in new weekly UI claims in New York relative to the nation suggests that this disparity might be on track to increase when the September 2020 estimates are reported over the next few weeks.
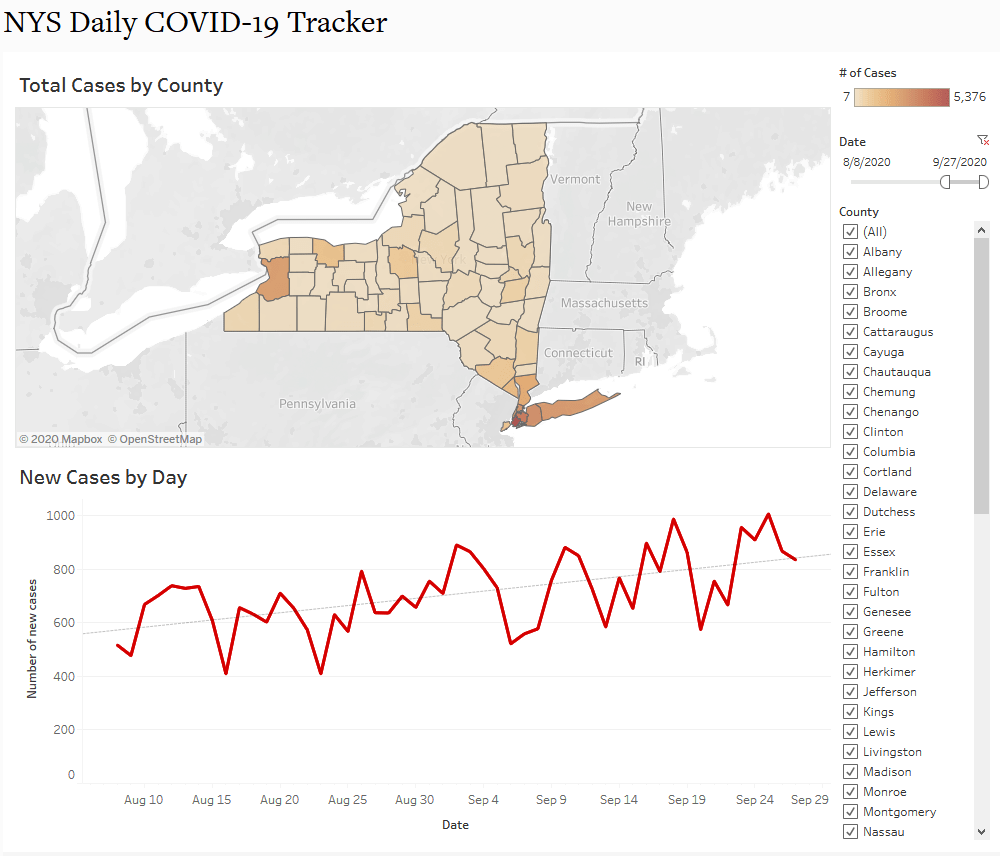
Although there are many, intersecting reasons why New York State continues to experience disparately high unemployment relative to the rest of the country, two prominent factors are worth highlighting. First, COVID-19 has been especially problematic in New York State. As of 27 September 2020, New York has recorded more COVID-19 deaths than any other state and is second in deaths per 100,000 persons. Although the State “flattened its curve” earlier than most others and has been mostly successful at keeping cases down since mid-June, the start of academic school years and more comprehensive economic reopening have coincided with an uptick in cases since at least early August. Below is a current snapshot (data available through 27 September 2020) of the Cornell ILR Buffalo Co-Lab’s new NYS Daily COVID-19 Tracker, where we show only cases that have been reported since 8 August 2020 – the date on which the State recorded its in-pandemic minimum level of new weekly UI claims (see above). As the graph makes clear, new COVID-19 cases have been trending upward since that time, even exceeding 1,000 daily cases on 25 September. For context, the last time the State recorded 1,000 or more new cases in a day occurred during the first week in June. Thus, it is possible – though not certain – that an upswing in cases could be contributing to new rounds of layoffs.
A second factor that is almost certainly responsible for the high unemployment in New York is the duration of the pandemic coupled with the lack of additional federal funding for State and local governments, and for American households writ large. Other than Wisconsin, New York experienced the biggest relative drop in state and local government jobs in the country between July 2019 and July 2020. Between pandemic-related shutdowns and budget shortfalls stemming from, among other sources, drastically reduced sales tax revenues due to COVID-induced drops in consumer spending, many public sector jobs in New York are becoming increasingly precarious. And the impacts go well beyond the public sector. The Economic Policy Institute (EPI) estimates that, without additional federal aid, more than 405,000 additional New Yorkers (public and private sector, combined) will lose their jobs by the end of 2021. That figure amounts to 4.1% of nonfarm payroll jobs in the State, slightly more than the 3.5% average that EPI estimates for the U.S. as a whole. In other words, New York’s already above-average unemployment problems are expected to get worse if Congress does not settle on a generous stimulus package in the coming days and weeks.
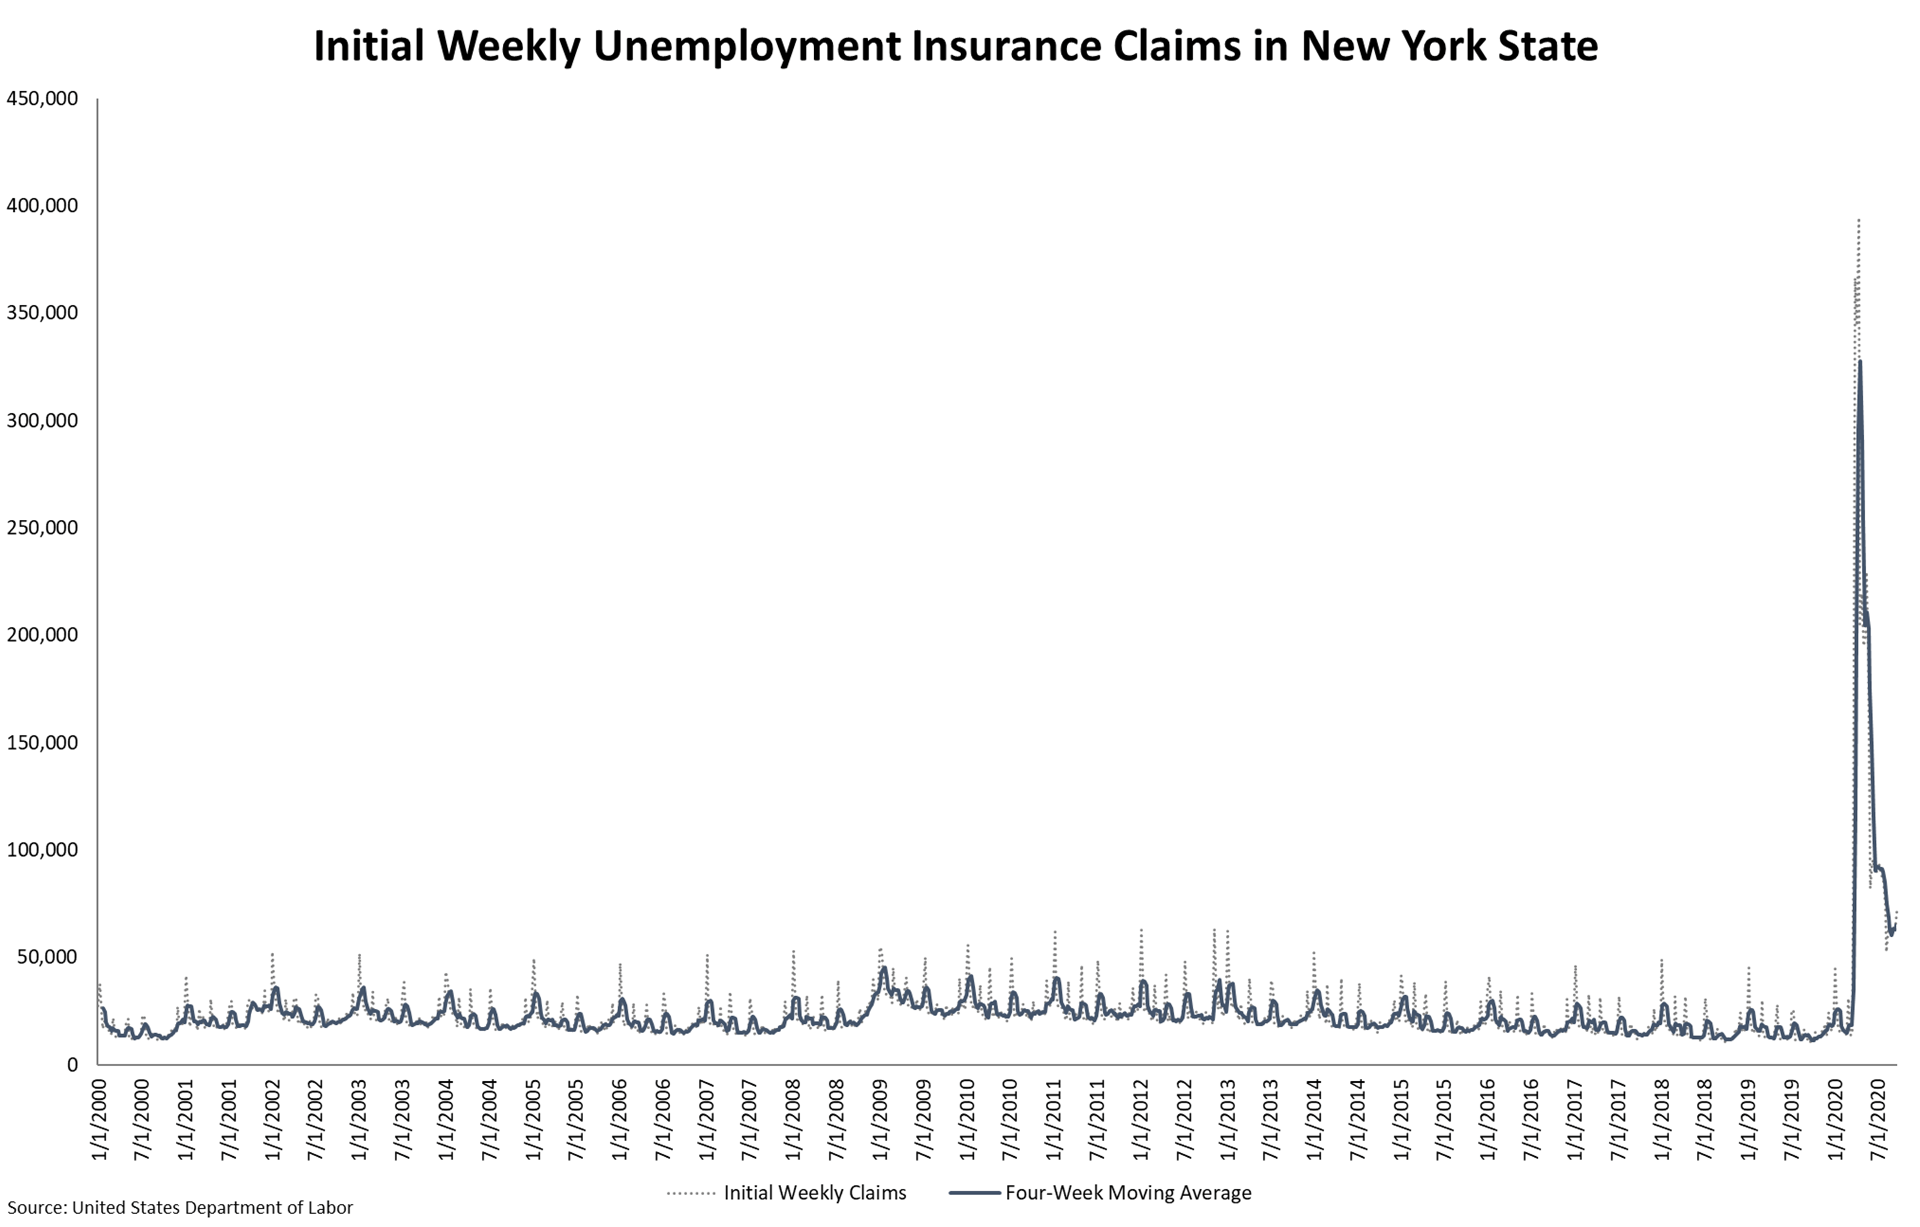
The bottom line, then, is that while we have made notable progress as a State and a nation in dealing with COVID-19 and its attendant economic impacts, there is still an enormous amount of work to do. Even the seemingly tempered levels of UI claims that have been occurring since June are orders of magnitude higher than what the State was processing immediately before the pandemic, or even during the depths of the Great Recession (see graph below). The total number of claims made since the end of March is a staggering 3.7 million – equivalent to around 40 percent of the March 2020 labor force in New York State. If that number of UI claims were a state, it would be the 29th most populous state in the nation, just ahead of Connecticut.
Recovery from a crisis of this magnitude is going to be a lengthy process. On the backdrop of public messaging that might be downplaying the severity of current circumstances for political purposes during an election year, it is essential to keep expectations in check – and to continue to demand, loudly, that federal officials take more and more aggressive actions to put public dollars in the hands of ordinary households, state governments, and local governments as we continue to navigate this historic public health emergency and economic recession.