NEW RESOURCE: WalkScore Cluster Map for Buffalo
From the May 14th Tops massacre, wherein a white supremacist purposefully targeted Buffalo’s Black population en route to murdering ten community members and wounding three others, to the December blizzard that has claimed at least 42 lives (mostly in the City), and to the New Year’s Eve house fire that took the lives of five Buffalo children, 2022 was a year of tragedy in the City of Good Neighbors. But tragedy, like essentially every other social, economic, and political phenomenon, is not something that is evenly distributed. The harms of 2022, in step with the legacies of social and economic injustice that date back to the settling, colonization, and formation of the nation, fell disproportionately on Buffalo’s communities of color — especially the City’s Black residents.
Whereas the multiplying and intersecting tragedies of 2022 moved some to take up catchphrases like “Buffalo Strong”, the City’s Poet Laureate, Jillian Hanesworth, has called for a deeper and more honest dialogue — not one based on platitudes and punchy slogans, but one that “bridge[s] the gap between what we know and what we need…” Toward that end, Hanesworth started the hashtag #BuffaloHonest as something of an open invitation and forum in which to hold difficult but necessary conversations about the discriminatory policies, institutions, and systems that create and sustain racial, gender, social, economic, and countless other forms of inequality in and beyond Buffalo.
Throughout 2023, as part of the Cornell ILR Buffalo Co-Lab‘s Equality Initiative, High Road Policy will be developing and releasing interactive tools and related resources that might contribute data and empirical insights to the #BuffaloHonest dialogue. The long-term output from these efforts is intended to be a comprehensive “Buffalo Indicators” dashboard/mapping application that will give users quick and easy access to data they can use to better describe and understand patterns of inequality in Buffalo. In the short-term, releases will take the form of specialized tools that focus on one or a small handful of key themes.
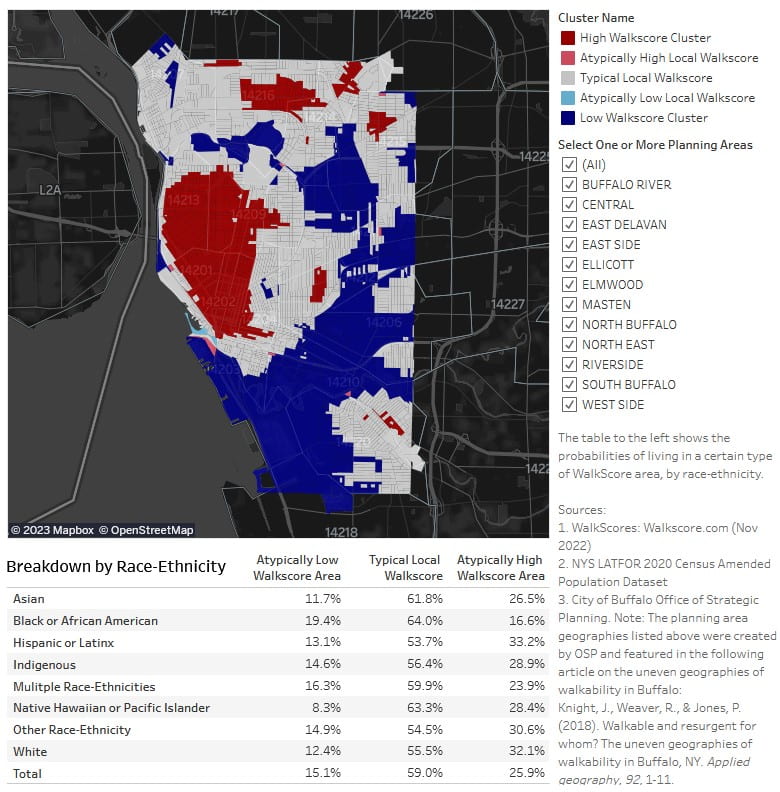
Insofar as Buffalo’s two deadliest mass tragedies from 2022 — the Tops Massacre and the December blizzard — both highlighted the ways in which development patterns have spatially separated certain communities, especially on Buffalo’s East Side, from critical resources (e.g., grocery stores, snowplows), the first release in this series focuses on walkability. The tool, found at the top of this page, provides data on census block-level WalkScores, as well as information on where census blocks come together to form High or Low Clusters of walkability. The tool also summarizes the likelihood of living in a highly walkable (or highly unwalkable) area in Buffalo, by race-ethnicity.
Across Buffalo, Black residents have the lowest chance (16.6%) of living in a census block that is part of a High WalkScore cluster (i.e., a highly walkable location). White residents are twice as likely (32.1%) as Black Buffalonians to live in the City’s most walkable spaces. At the same time, Black residents are the most likely group to live in Low WalkScore clusters (19.4%), or spaces with atypically low access to walkable amenities relative to the rest of the City.
Users can filter the data in the tool by Planning Area using the checkbox menu to the right of the map. Of the twelve planning areas, the West Side is the most walkable area — 82.3% of West Side residents live in High WalkScore clusters. East Delavan, by contrast, is the least walkable area of Buffalo — nearly half (47.2%) of the area’s residents live in Low WalkScore clusters, indicating poor access to walkable amenities. (Note: The Buffalo River planning area is the least walkable of the twelve regions by percentage, with 50% of residents living in Low WalkScore areas; however, this space contains a substantial amount of industrial land and is not highly populated. The entire Buffalo River area is home to just 4,292 residents. For comparison, East Delavan has more than eight-times the population, with 35,326 residents. Thus, there is a solid argument that East Delavan is the least walkable planning area in Buffalo, as it contains more residents living in Low WalkScore clusters [16,682] than any other part of the City, by a wide margin.)
To access the tool, click on the image below, or copy and paste the following URL into a web browser: https://blogs.cornell.edu/highroadpolicy/buffalo-block-level-walkscore-cluster-map/