Welcome
Welcome to the Cornell ILR Eviction Filings Dashboard for New York State, presented by the Cornell University ILR School Buffalo Co-Lab. The tools collected on this website are part of the Co-Lab’s initiative to democratize data that can help New Yorkers better understand, and organize to transform, persistent patterns of inequality across the state.
The NYS Eviction Filings Dashboard presently contains five tools:
- A basic County-level interactive map that shows annual eviction filings as a percentage of renter-occupied households, from 2019 to 2022.
- A ZIP Code-level interactive map that reports on annual eviction filings from city and district courts across the state, from 2018 to 2022.
- A tool for generating factsheets for individual ZIP Codes that summarize key characteristics of a ZIP Code’s population and households, with a focus on renter households.
- Two tools that generate housing factsheets for NYS legislative districts (one for the Senate and one for the Assembly). These tools have the added feature of allowing users to see how districts compare to one another on various housing-related indicators, including eviction filings.
Read below for more information on these tools and how to use them.
Note: We strongly advise accessing these tools using a web browser on a desktop or laptop computer with a screen resolution of at least 1366 x 768 pixels.
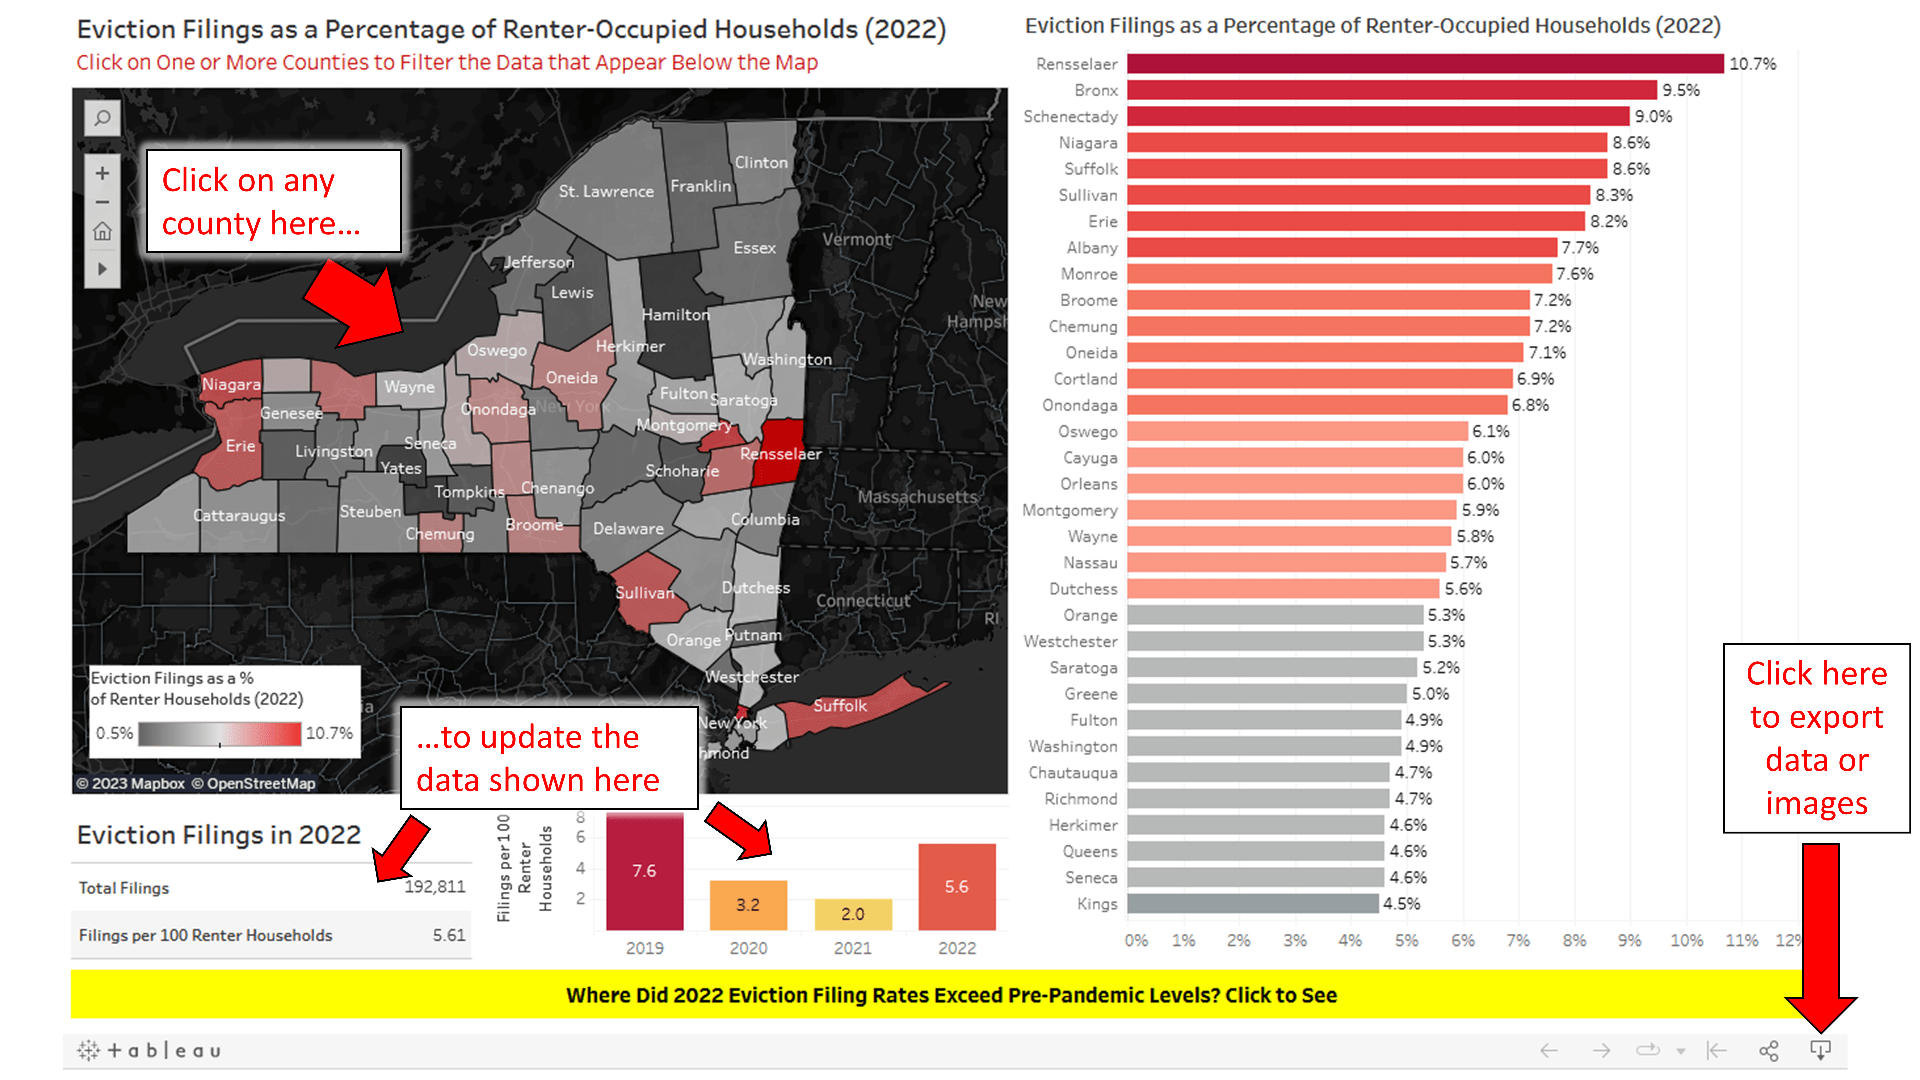
Tool 1: Eviction Filings by County
The data for this tool were obtained from the NYS Unified Court System’s Statewide Landlord Tenant Evictions Report Dashboard, and the tool itself serves as a complement to that dashboard. Whereas the court’s dashboard allows users to visually explore eviction filings by county, it does not allow for data exporting. Further, the state’s tool calculates eviction filings as a percentage of all households in a county, regardless of housing tenure.
As shown in the screenshot below, our Eviction Filings by County tool reports filings as a function of renter-occupied households — data which were obtained from the current, 2017-21 U.S. Census Bureau Five-Year American Community Survey (ACS) — and allows users to export the source data.
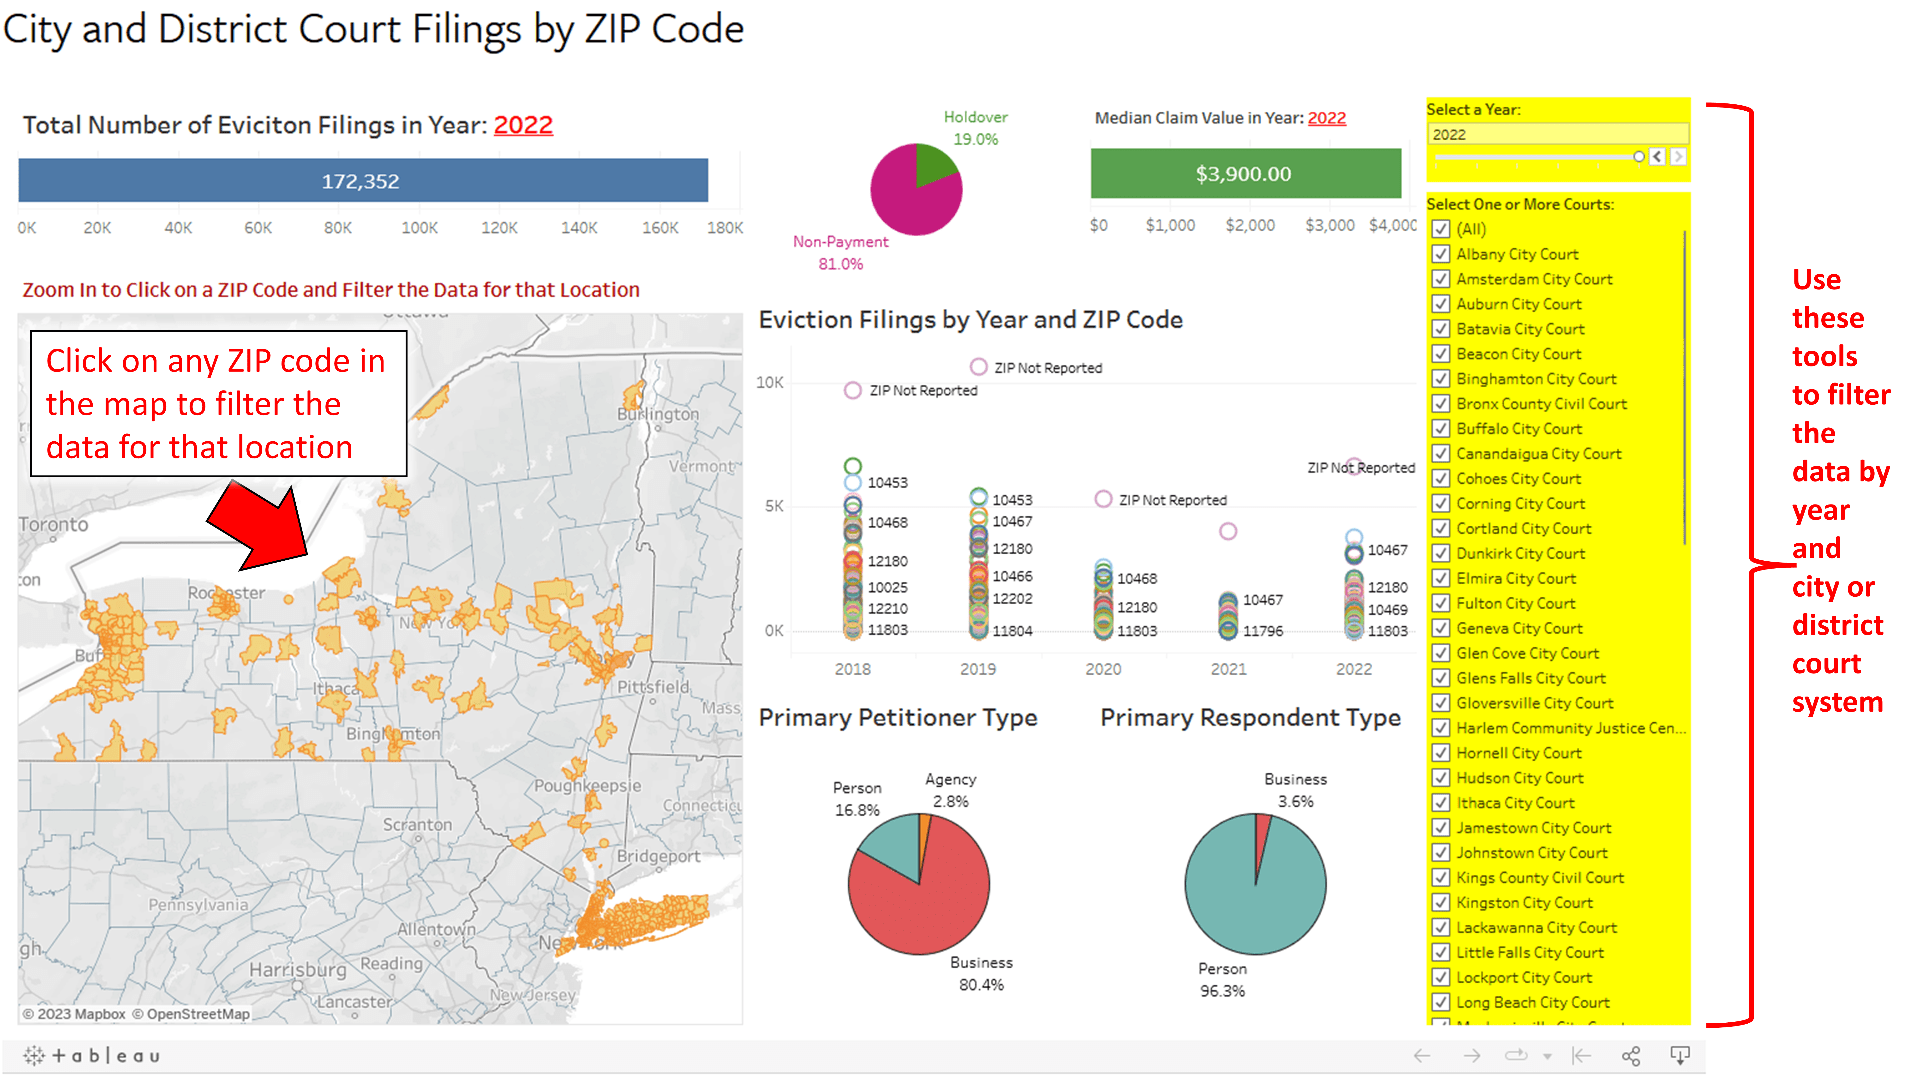
Tool 2: City and District Court Filings by ZIP Code
Data for this tool were obtained from the City and District Court Landlord-Tenant Data XML extracts published by the NYS Unified Court System. As the court cautions, these data extracts do not include eviction filings from Town and Village courts, meaning that the total number of filings reported in these datasets will differ from (be less than) the number of filings reported in the countywide tool (see above). The exclusion of Town and Village court data from the NYS Unified Court System extracts means that not every ZIP Code in New York will be represented in the dataset. Rather, coverage is best in larger cities.
As shown in the screenshot below, this tool provides access to the five most recent full years of eviction filings data (2018-2022). Key variables reported include, in addition to the number of filings by year, the types of parties involved in each filing and the variation in filings by ZIP Code. Users can filter the data by year, and for individual ZIP Codes or one or more court systems.
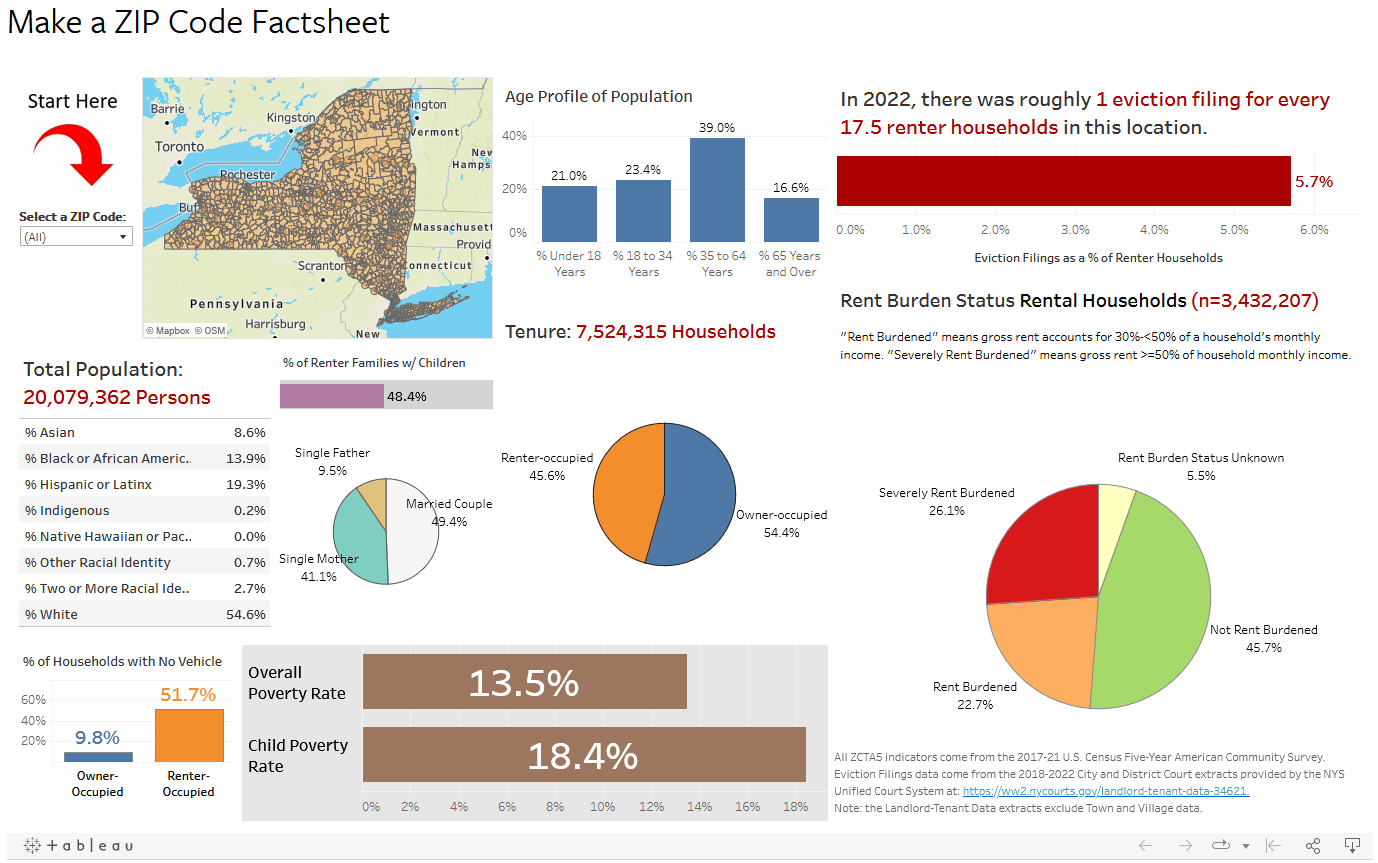
Tool 3: ZIP Code Factsheet Generator
The third tool allows users to generate a factsheet for any ZIP Code in New York State. If the selected ZIP Code was associated with city and district court eviction filings in 2022, then the factsheet will juxtapose information on the rate of filings per rental household in that ZIP Code with relevant facts about the ZIP Code’s population and households, with an emphasis on renter households. All population and household indicators were sourced from the current, 2017-21 U.S. Census Five-Year ACS (Note: the ACS publishes data for ZIP Code Tabulation Areas, or ZCTA5s, which are geographic proxy representations for mailing ZIP Codes. The latter are created for mail delivery purposes only and are not associated with specific geographic boundaries.).
To use this tool, simply select a ZIP Code from the dropdown menu pictured in the top-left of the interface (see screenshot below). As a shortcut, click on the dropdown menu arrow, type a desired ZIP Code, and then click on that ZIP Code when it appears in the dropdown menu. In ZIP Codes for which no city and district court eviction filings data are available (or where there were zero filings), the eviction indicator bar graph in the top-right of the interface will return a value of “None”. However, the remaining indicator graphs and tables will function as intended.
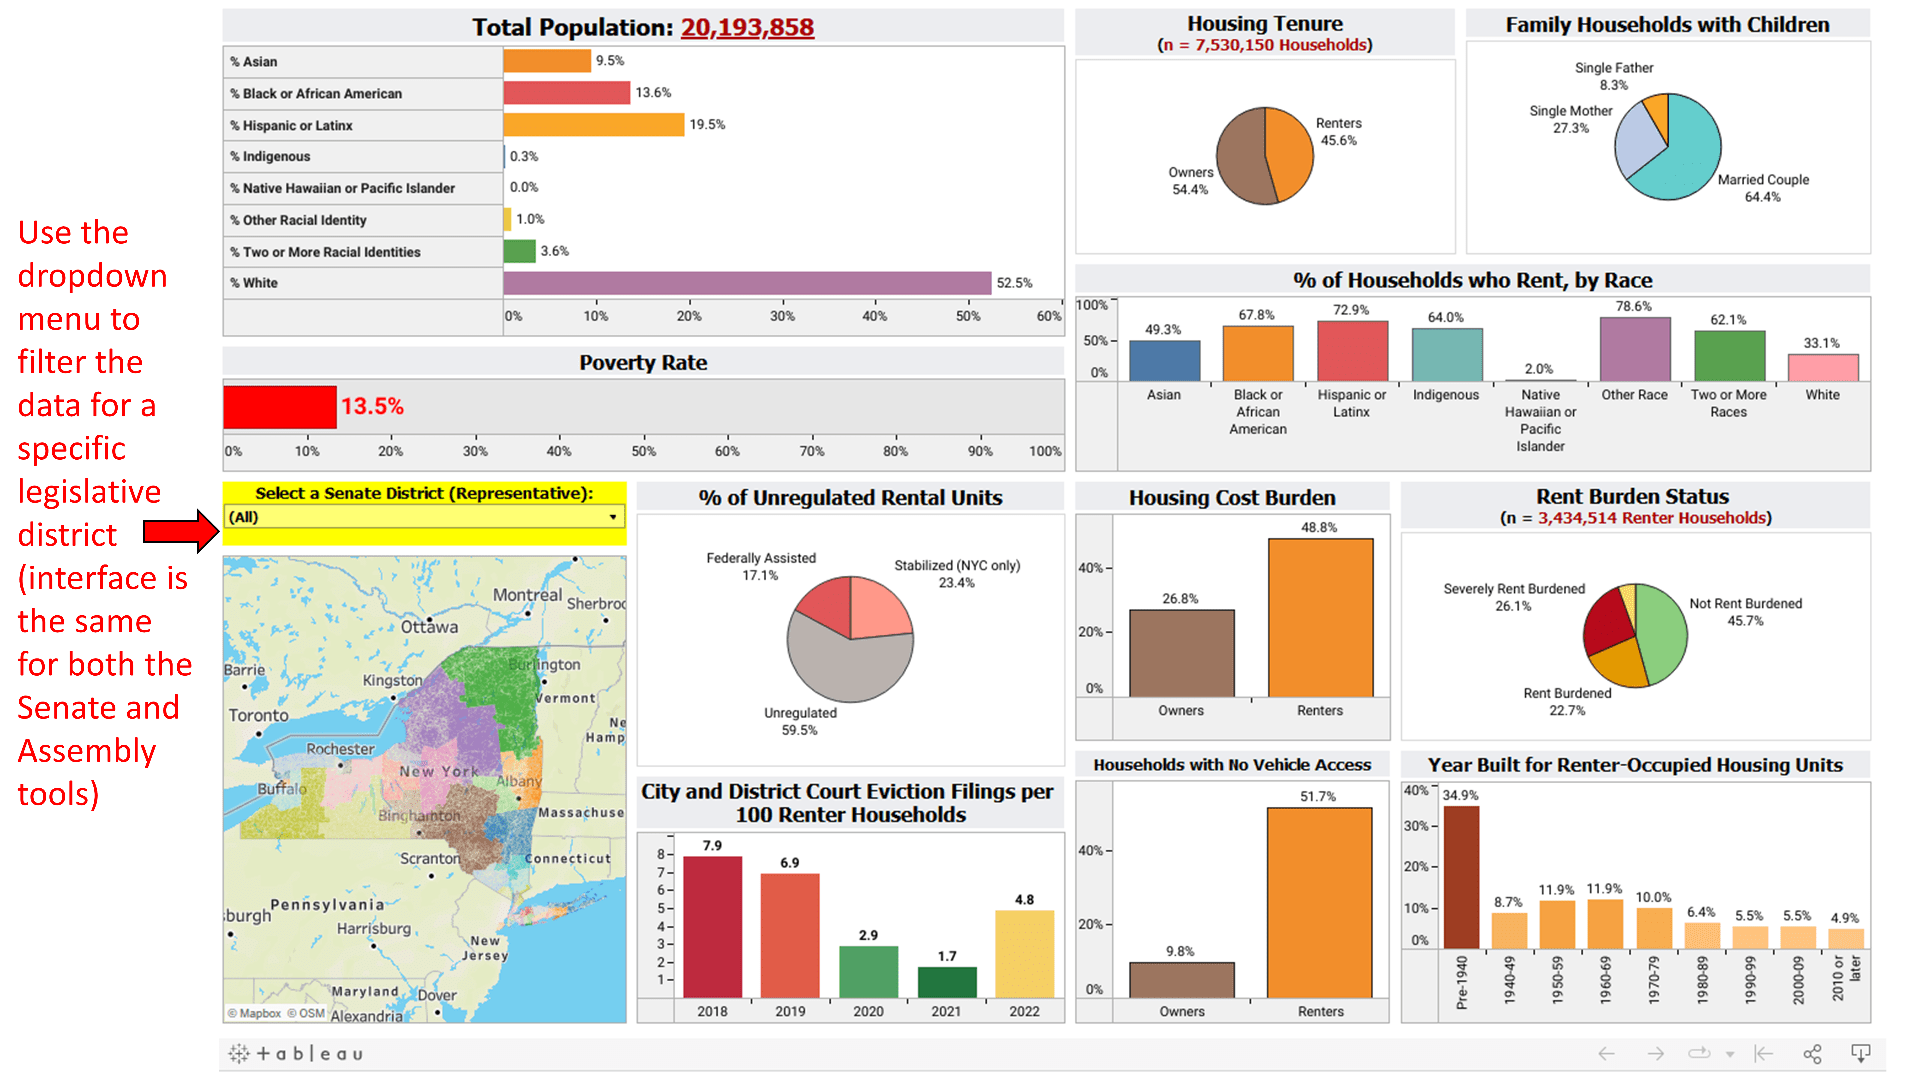
Tools 4-5: State Legislative District Factsheet Generator
Finally, the fourth and fifth tools allow users to generate housing-related factsheets for any New York State Senate or Assembly District, respectively. These tools operate much like the ZIP Code factsheet generator, though they contain a slightly different set of indicators due to data availability constraints. Namely, for privacy reasons, the Census Bureau does not publish all of the data it collects at its smallest units of geography. For larger units, like Zip Codes, the available data are rather rich, including essentially all the data topics covered by the Census’s survey instrument. For the smallest units of analyses represented in the Census American Community Survey (ACS), some data points — including child poverty — are withheld. Importantly, because NYS just underwent legislative redistricting, meaning that Senate and Assembly Districts recently experienced boundary changes, Census data are not yet available for these geographic summary levels. As such, indicators for the new district boundaries need to be constructed from smaller units of analysis. Following the model of the Buffalo Co-Lab’s legislative district information system for Buffalo, data for key housing-related indicators were collected at the census block group level and disaggregated to the smaller block level using population-weighting. The reason for this disaggregation is that legislative districts are drawn using census blocks — census blocks are the literal “building blocks” for legislative districts. As such, block level data can be neatly aggregated to legislative district boundaries.
The Senate and Assembly Housing Factsheet builder tools on this website are therefore driven by disaggregated Census block group-level data. As shown in the screenshot below, even though some relevant indicators (e.g., child poverty) are not available at the block group-level of analysis, the Census still provides a rich set of housing-related indicators for block groups. To use the tools, users can simply select a legislative district from the provided dropdown menu to generate a factsheet for that district.