What is New York State’s Current Unemployment Rate? More Estimates Ahead of Upcoming BLS Data Releases
19 May 2020
The current unemployment rate in New York State might be around 16%. In the Buffalo-Niagara metro, unemployment may be closer to 19%.
This Friday, 22 May 2020, at 10am EST, the Bureau of Labor Statistics (BLS) will release its State Employment and Unemployment Data for April 2020. Similar to what the BLS April 2020 Employment Situation report from two weeks ago added to the national conversation, the upcoming release will provide the clearest picture to date on how COVID-19 has impacted jobs and the economy for individual states. (Note: the BLS Metropolitan Area Employment and Unemployment data release for April is scheduled for 3 June 2020.)
In prior coverage, we presented results from internal Cornell ILR Buffalo Co-Lab models that have been tracking the state unemployment rate as a function of aggregated monthly unemployment insurance (UI) claims. Our conservative model pegged the April 2020 New York State unemployment rate at about 13% of the March 2020 civilian labor force. When excluding an outlying/influential observation, our less conservative – and more representative – model projected a statewide, seasonally-adjusted rate of between 15% and 15.5%. In other words, our model suggests that the official unemployment rate in New York State is somewhat higher than the national rate of 14.7% that was announced earlier this month.
Although we will have to wait a few more days for official, seasonally adjusted BLS state-level estimates, the national data, coupled with raw (not seasonally adjusted) U.S. Census Bureau Basic Monthly Current Population Survey (CPS) data for April 2020, provide an opportunity to revisit our earlier analysis in light of new information. Such an exercise can help set expectations for state and local public officials who are looking for answers to questions about the magnitude of the unemployment crises that their jurisdictions are facing.
Toward that end, there are two avenues worth traveling. First, there is the similarity between (1) the official March 2020 unemployment rates for the U.S. and New York State, and (2) the relative number of aggregate UI claims made in each location between the end of March 2020 and the end of April 2020. Concerning the former, the official national unemployment rate in March 2020 was 4.4%. In New York State, the figure was 4.5%. With respect to the latter, as we previously reported, the number of UI claims made since mid-March in both the U.S. and New York State sums to just over one-fifth of each jurisdiction’s March 2020 civilian labor force. Based on these similarities, it is reasonable to expect New York State’s official unemployment rate to mirror – though remain slightly higher than – the national rate for the second consecutive month. By that logic, we might expect to see an official New York State unemployment rate in the neighborhood of about 15%.
The second avenue worth traveling involves a more systematic exploration of raw Public Use Microdata Sample (PUMS) responses to the monthly CPS survey for April 2020, on which the official unemployment rates are based. Importantly, these data undergo post-processing and seasonal adjustment by the BLS. As such, estimates based on them will differ slightly from the official estimates that are due to be released on Friday. However, they offer critical starting points for quantifying the scale of unemployment in states and metropolitan regions.
Along those lines, we: (1) downloaded the Basic Monthly CPS data for April 2020; (2) filtered the dataset down to the civilian labor force; and (3) applied Census Bureau-provided final weights to compute unadjusted April 2020 unemployment rates for New York State and a handful of selected metropolitan regions in the State. The results from this analysis are graphed below. The national unadjusted unemployment rate is included in the graph as a benchmark.
Observe that, consistent with our earlier expectations, unemployment in New York State appears to be higher than the national average. Specifically, the Basic Monthly CPS PUMS data for April 2020 suggest that New York’s statewide unadjusted unemployment rate is around 16.1%. By comparison, the unadjusted estimate for the United States is currently 14.4%.
Unofficial April 2020 Unemployment Rates for New York State and Selected Metro Areas (not seasonally adjusted)[1]
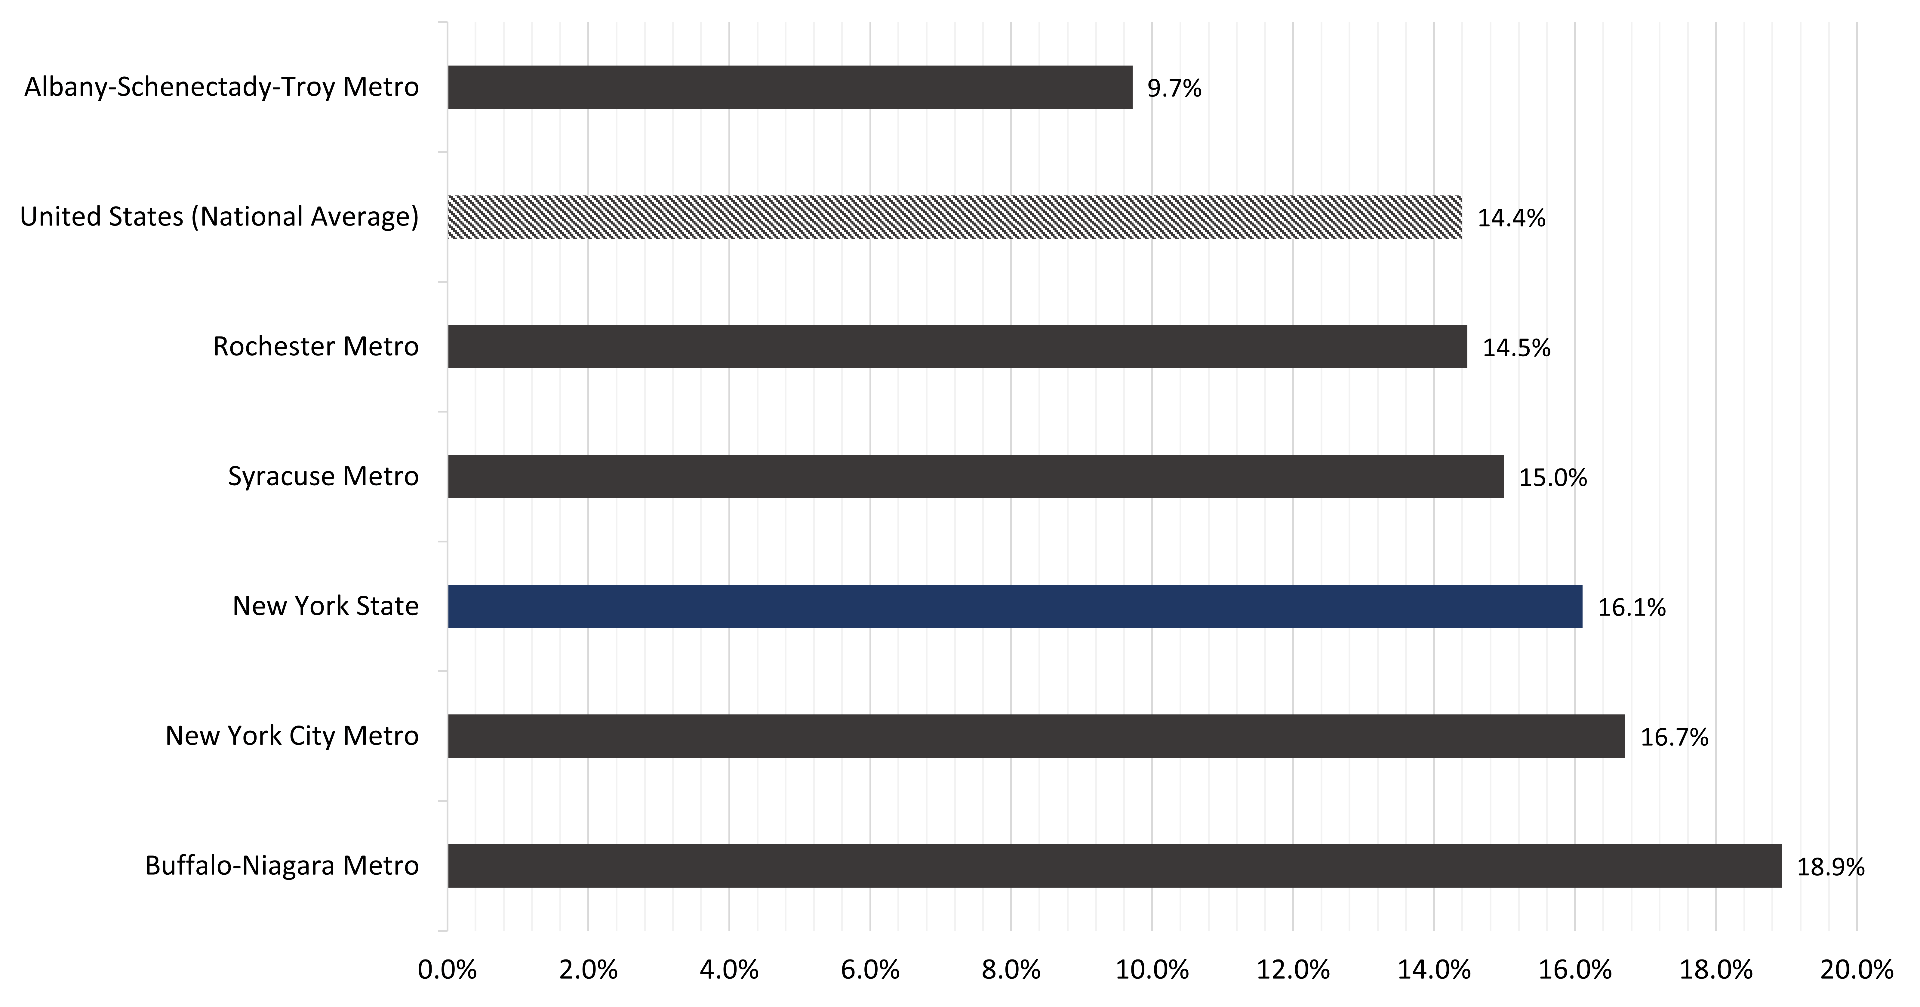
Consistent with our breakdown of unemployment by New York State Labor Market Region (LMR), metro areas in the New York City (NYC)[2] and Western New York (WNY) LMRs appear to have the highest current unemployment rates in the State; while metros in the Capitol and Finger Lakes LMRs seem to have lower unemployment rates. The Syracuse metro, in Central New York, is just below the State average.
How do the CPS Basic Monthly estimates compare to ILR Buffalo Co-Lab estimates?
At the State level, our less conservative model – which omitted a highly influential observation from our analysis – predicted an April 2020 unemployment rate for New York of about 15.5%. More precisely, our model predicted that 1.456 million New Yorkers would be included in the official April 2020 unemployment tally. The raw CPS data are nearly identical to these figures. After weighting CPS Basic Monthly observations with Census Bureau-provided weights, the raw number of New Yorkers classified as unemployed in April 2020 is about 1.436 million persons. In that sense, our model overpredicted the number of unemployed persons by just 20,000 individuals (a difference of only 1.4%).
So, if our model slightly overpredicted the number of unemployed persons, then how could it have seemingly underpredicted the unemployment rate? (Note: our estimate of 15.5% is less than the raw, unadjusted rate of 16.1% implicated in the CPS data.) The answer to that question is quite straightforward. Namely, we used the March 2020 New York State civilian labor force as the denominator to compute the predicted unemployment rate. According to the Basic Monthly CPS raw data, though, the civilian labor force may have contracted by about -5.9% between March and April 2020. (Note: that contraction is more extreme than the month-to-month change of -3.9% reported for the national civilian labor force.) After adjusting for this new information, our April 2020 New York State unemployment estimate goes from 15.5% (1.456 million unemployed divided by 9.437 million workers) to 16.3% (1.456 million unemployed divided by 8.915 million workers), just ahead of the 16.1% estimate from the raw April 2020 Basic Monthly CPS data.
Why does this comparison matter?
While we are scheduled to receive official BLS estimates of New York’s statewide unemployment rate this Friday, we will not receive any finer resolution estimates for metropolitan regions until early June. In the meantime, local officials and stakeholders need to know the scale of their place-based unemployment challenges as they work to craft policy responses. In that vein, the tight correspondence between our statewide estimate (16.3%, after adjusting for labor force contraction) and the New York State estimate from the raw April 2020 CPS data (16.1%) suggest that our LMR-level predictions are likely to hold some water.
The metro area-specific estimates from raw CPS data add further weight to this claim. Just as we estimated that unemployment rates in the NYC and WNY LMRs are likely to be one-to-two percentage points higher than the statewide estimate, the CPS data show that unemployment rates in the major metropolitan regions in these LMRs are indeed greater than the State average. For Buffalo-Niagara in the WNY LRM, the raw, unadjusted unemployment rate implicated in the April 2020 CPS data is nearly 19%. At the same time, the relatively lower CPS-based unemployment rates in the Albany-Schenectady-Troy and Rochester metro areas support our predictions that the unemployment crises are less severe – though still devastating – in the Capitol and Finger Lakes LMRs. Finally, the raw CPS estimate for the Syracuse metro is consistent with our expectation that unemployment in the Central New York LMR is around the State average.
With that being said, the new data do not allow us to accurately adjust the size of the civilian labor force by LMR in order to update our LMR-specific unemployment predictions. For that reason, some of the rates that we initially predicted might slightly underestimate regional unemployment. However, based on (1) the close agreement between our predicted statewide unemployment rate and the CPS-based rate, and (2) the consistencies between our LMR-based predictions and the CPS-based estimates for selected metro regions, we are reasonably confident that our LMR predictions reflect, at minimum, an accurate ranking of unemployment severity across the State. Thus, below, we reproduce our “less conservative” estimates from a few weeks ago. In the table, LMRs are arranged from lowest to highest predicted April 2020 unemployment rates. These rankings arguably have immediate value for informing state and local responses – including geographically-based resource allocations – to New York’s shared, but spatially uneven, COVID-related unemployment crises.
Estimated April 2020 unemployment rate ranges in New York State, by Labor Market Region (LMR) – Ranked from low to high*
| Estimated Unemployment Rate Ranges | LMRs in Range |
| 12% to less than 14% | Capitol Finger Lakes Hudson Valley |
| 14% to less than 16% | Southern Tier Mohawk Valley Long Island Central New York North Country |
| 16% or greater | New York City Western New York |
New York State Labor Market Regions (LMRs)

A final caution
It bears repeating that the State- and metro-level unemployment rates presented in the above graph were computed using raw PUMS data from the April 2020 Basic Monthly U.S. Census CPS data release. Consequently, they will almost certainly differ from the final, seasonally adjusted estimates set to be released by the BLS this Friday (for states) and in just over two weeks (for metro regions). In other words, the data points presented in this post are unadjusted, unofficial estimates. They are intended to provide initial information on both the magnitude of the unemployment crisis in New York State, and the spatial unevenness in the distribution of unemployment across Labor Market Regions (LMRs). Attempts to generate such information now can help to inform on-the-ground policy responses, and can empower public officials and policy advocates to actively push policy strategies forward in the present. Please keep these caveats and aims in mind when citing the data from this post.
—