Monitoring is a critical part of managing SWD. Dr. Juliet Carroll and her many collaborators from around NY State have been working to provide and improve monitoring since 2013, sharing information from the SWD monitoring network in this blog. Over the past two years, our team has evaluated traps to make monitoring easier. I was fortunate to begin working with this group in 2023, as the new Fruit IPM Coordinator with the NYS IPM Program, and am pleased to summarize the result of the past two years.
As noted in a previous post, monitoring can save unnecessary sprays in a late infestation year, reducing time and labor, decreasing pesticide use, and protecting against pesticide resistance. In an early year it can also ensure adequate protection is in place, and production of high-quality fruit. However, monitoring is time-intensive and requires specialized equipment. Identifying an easier monitoring method is also critical because the SWD-network can only provide county trends, not farm-specific information. Over the past two years, a team across the state compared jar (drowning) traps with red sticky cards, to see if they are as effective at detecting SWD. Thanks to Laura McDermott, who received a Smith-Lever Federal Capacity Fund grant to do this work!
2023 Monitoring Results. In 2023, the SWD monitoring network included 118 monitoring locations in 24 counties, maintained by 18 individuals. First trap captures were reported from June 13-July 20, and sustained captures a week later (sustained capture = SWD detected at least two weeks in a row). This is considerably later than average; in many years, first capture occurs in mid-May, almost a month earlier! 2023 was a brilliant example of how monitoring can be used to delay pesticide applications until insects are present, saving time, labor, and materials.
Traps in the SWD monitoring network are located on commercial farms, and typically serviced by Cornell Extension Personnel or grower collaborators. In addition, some growers have begun servicing their own traps, with our guidance or from reading the online resources.
Are you monitoring for SWD (Spotted Wing Drosophila) on your farm? We'd like to know! Please complete this 6-question survey about your SWD monitoring. https://cornell.ca1.qualtrics.com/jfe/form/SV_2iBzQU9NpKO1WKO
Trap Comparison Methods & Results. Over the 2022 and 2023 growing seasons we compared jar and sticky traps at berry or cherry plantings across New York state. At each site, two of each trap type were placed along the edge of the berry patch or orchard, spaced 50 meters apart. Traps were monitored weekly through sustained trap capture (two consecutive weeks of at least one SWD in the trap) and the number of SWD observed in each trap was recorded.
SWD monitoring traps are available for purchase from Great Lakes IPM: https://www.greatlakesipm.com/product_search/?q=swd
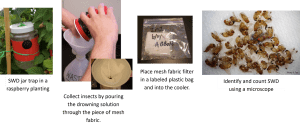
Jar traps. Scentry jar traps with lure have been used since 2016 in the SWD monitoring network. They require filling a plastic jar trap with a ‘drowning solution’ of soapy water, and attaching a Scentry lure. The trap is placed in the canopy and monitored weekly. Drowning solution must be filtered using a funnel and fine mesh, and its contents is taken to the lab to identify flies under a dissecting microscope. Research has consistently demonstrated that these traps are among the most effective and sensitive for early detection of SWD. However, the process of monitoring is tedious, time-consuming, and requires specialized equipment, and may be too onerous for commercial growers.
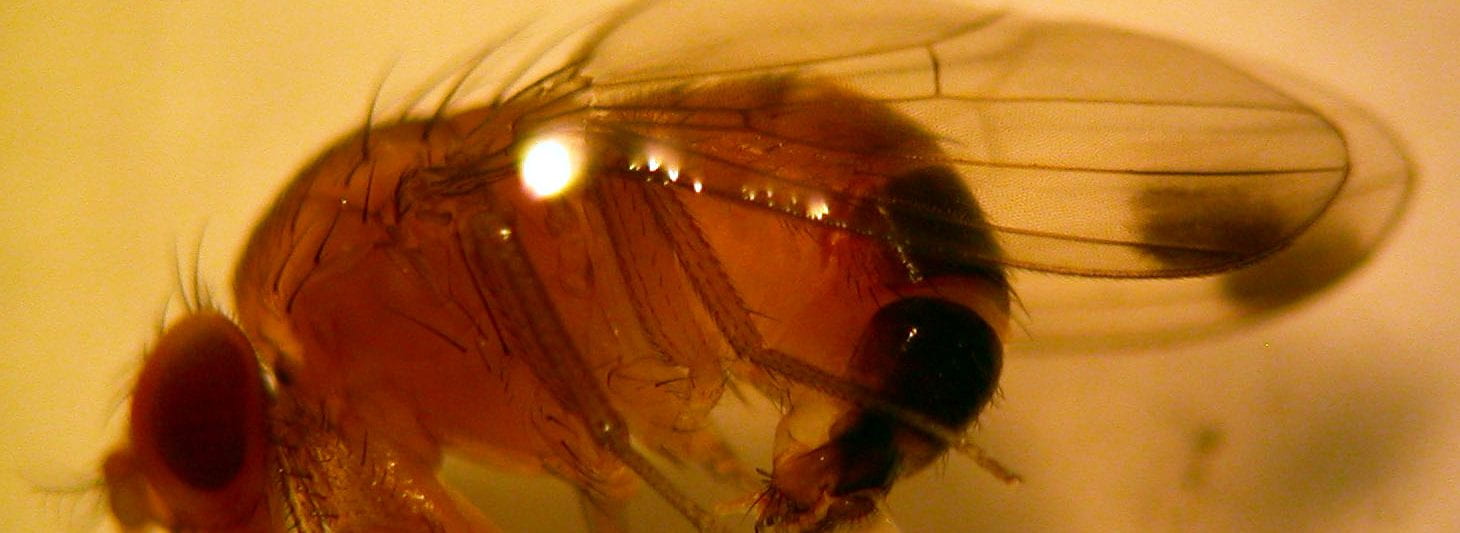
Sticky cards. An alterative to jar traps are sticky cards. These red cards are affixed in the canopy along with a Trécé scented lure, and are monitored weekly for SWD. The cards are examined for male SWD in the field, which are easy to identify using a hand lens or optivisor, by the characteristic spots on the tips of the wings.
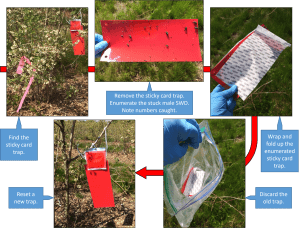
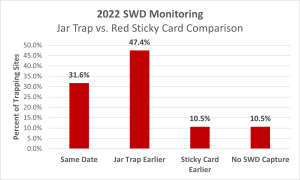
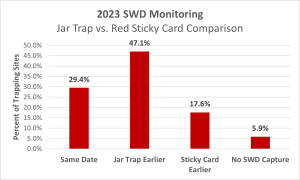
In 2022, jar and sticky trap detection dates were the same at 6 of 19 locations (31.6%), jar traps were earlier at 9 locations (47.4%), sticky traps were earlier at 2 locations (10.5%), and at 2 locations SWD was not detected (10.5%). In 2023, detection was the same for trap types at 5 of 17 locations (29.4%), jar traps were earlier at 8 locations (47.1%), sticky traps were earlier at 3 locations (17.6%), and at 1 location SWD was not detected (5.6%). Our results indicate that jar traps may detect SWD earlier than sticky traps a slightly larger proportion of the time, as long as monitoring is conducted correctly by a trained individual with access to appropriate tools. However, sticky traps detected SWD earlier at many locations, and required considerably lower input.
We believe the two trap types offer a similar level of detection and that user preference likely plays a large role in the successful implementation. Having multiple trap types available is likely to increase the practice of monitoring, thus site-specific detection of SWD and targeted pesticide use to reduce fruit infestation and other negative consequences. Further improvements to the sticky traps (grid lines, yellow color) may make improve user-friendliness (and therefore detection) and will be evaluated in the future.
Our results in 2022 and 2023 are consistent with preliminary work in 2021 in NY, and with what teams are finding in other locations. Preliminary trials in 2021 in NY included 20 sites, in which first trap catch was compared for Scentry-lure-baited jar traps vs. Trécé -lure-baited red sticky cards. “First catch on the red sticky cards compared to the jar traps was about one week earlier at 40% of the trap locations (8 out of 20), about one week later at 45% of the locations (9 out of 20) and on the same date at 15% of the locations (3 out of 20).” This suggested that the red sticky cards work comparably to the jar traps.
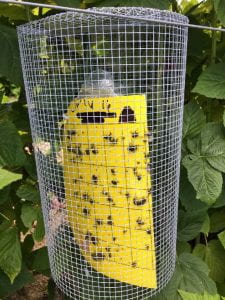
The Sustainable SWD Management Team has over two years of data from locations across the country indicating that jar traps and red sticky cards offer comparable efficacy and sensitivity for early detection of SWD. Research evaluating these and other monitoring devices is ongoing. A webinar summarizing research updates on monitoring tools was shared in 2021. In addition, our colleagues in Ontario have been testing yellow sticky card traps, which may make it easier to see insects. They have been testing with and without cages, which prevent messy buildup of debris and capture of non-targets. Their results from two years of research indicate that yellow sticky cards may be as effective as red cards, and that round cages (but not flat “sleeve” cages) are effective at keeping cards clean and detecting SWD. In 2024 our team plans to include tests comparing these yellow cards to the other types of traps in NY.
Acknowledgements. I’d like to extend a huge thanks to Dr. Juliet Carroll and the many collaborators around NY state who have provided support for SWD in this trap comparison project for the past three years, as well as the monitoring network and blog since 2013!
2023 Collaborators:
Amy Edwards, Burdick Blueberries
Anya Osatuke, Harvest New York, CCE
Dan Gilrein, Suffolk County CCE
Don Gasiewicz, Wyoming County CCE
Elisabeth Hodgdon, ENYCHP, CCE
Elizabeth Tee, Lake Ontario Fruit Program (LOF), CCE
Gary Phelps, Gary’s Berries
James O'Connell, Ulster County CCE
Janet van Zoeren, Lake Ontario Fruit Program (LOF), CCE
Jared Dyer, Suffolk County CCE
Jennifer Staton, ENYCHP, CCE
Jonny Williams, Northstar Blueberry Farm
Laura McDermott, ENYCHP, CCE
Natasha Field, ENYCHP, CCE
Nick Hamilton-Honey, CCE
Support for this work was provided by the NYS Berry Growers Association, the NYS IPM Program, and the USDA NIFA CPPM EIP Award 2017-70006-27142.
Sustainable SWD Management swdmanagement.org/
- Anna Wallis, Fruit IPM Coordinator, NYS IPM Program
This blog was co-authored by Laura McDermott, Janet van Zoeren, and Anya Osatuke. Eastern NY Commercial Horticulture Program, Lake Ontario Fruit Program, and Harvest NY, respectively, all with Cornell Cooperative Extension.

