Predicting Bugs in Software using Social Network Analysis Techniques.
One of the most familiar examples of networks for computer scientists comes in the form of dependencies. Users of popular languages like Python or JavaScript have most likely used extensive external libraries that co-depend on each other, creating a network of code that relies on other code to function. For developers who want to design good quality software, analyzing internal dependency networks can provide insight into how to maximize program quality with the limited time and budget constraints of a project.
In a study of productivity and correctness in software development, Nguyen et al. applied social network analysis to dependencies between software modules with the goal of predicting the “most important” modules in a project that should be prioritized during testing to reveal and fix bugs quicker. While the study of dependency networks has existed for decades, Nguyen et al. determined several social network analysis metrics that could be used to gauge importance that would mostly likely be missed by traditional complexity analysis (lines of code, number of classes, etc.). The researchers used an open-source project, which allowed them to track public bug fixes and the code structure throughout the project’s development. In their network construction, a node was a code module (a class or package depending on the scope being analyzed) and an edge between nodes A and B depicted a dependency — either A calls, inherits from, or refers to a variable in B.
A particularly effective social network metric for predicting bugs was “2-Step Reach-in,” which is defined as “the percentage of nodes in the global network that are indirectly connected to the… class via its incoming connections within two steps.” Specifically, they found that a lower 2-step reach-in value indicated lower risk for bugs, while a higher value indicated a higher risk. In practice, this echoes standard software design dogma: broad modules that are called by many other modules are at higher risk for bugs, while narrowly-defined, well-encapsulated modules are at lower risk for bugs. So, applying social network analysis offered a quantifiable way to measure “good” design in software, and determine which modules are at highest risk for bugs.
In class, we performed a similar analysis of a node’s “importance” when we measured power in a bargaining network in class (section 12.1). Whereas more important nodes should gain more favor when dividing money, the more important nodes in internal dependency networks should gain more favor when dividing the development resources of a team. Also, in lecture we examined many different definitions of what makes a node “important” – many of which were used in the social network analysis of dependency networks. For example, Nguyen et al. found that the volume of information that flowed through a module offered good predictability for bugs. This correlates with the notion of betweenness discussed in the course textbook (section 3.6), especially with the Girvan-Newman method using traffic volume across edges.


Examples of the social network analysis metrics used in predicting bugs. Many are extremely similar to definitions covered in lecture and in the textbook (section 12.1)
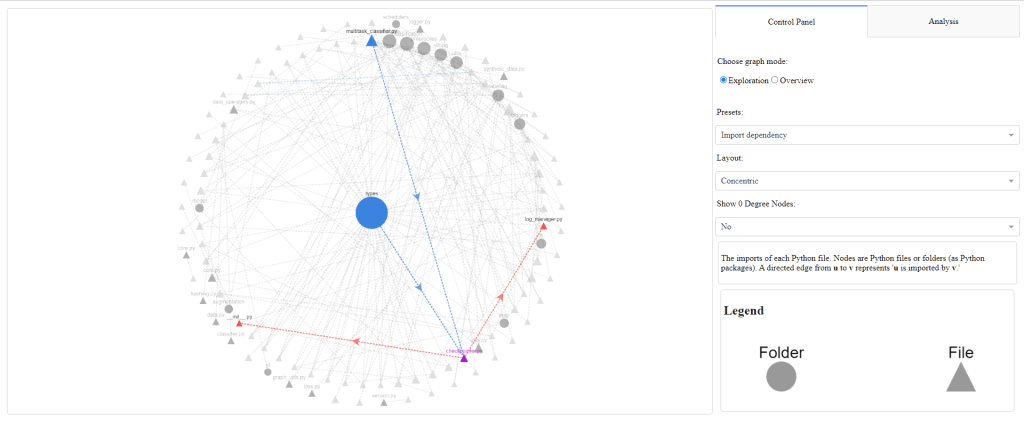
Even beyond this course, my own research during the summer of 2021 had a similar goal of discovering “important” modules in a code repository. To aid developers in understanding the structure of their projects, we created a tool to analyze dependencies and other coupling relationships between different Python code files. By visualizing these relationships with an interactive dashboard, we aimed to leverage human intuition to discover potentially problematic architecture in a project. Unknown to us at the time, many of the concepts covered in this course and the principles elaborated by Nguyen et al. can explain the intuition as a software developer for what makes certain software well-built, and other prone to bugs.
jks273
Study
https://ieeexplore.ieee.org/abstract/document/5609560
Module analysis tool
https://github.com/antoniopugliese/module-structure

