Graphs in Engineering Curriculum
Engineering curriculum can be very confusing, and advising offices often work to make the requirements easier for students to understand. One method that is employed here at Cornell Engineering is a major flowchart. A major flowchart is a perfect example of a graph in a real world situation, that works to make the user’s life easier.
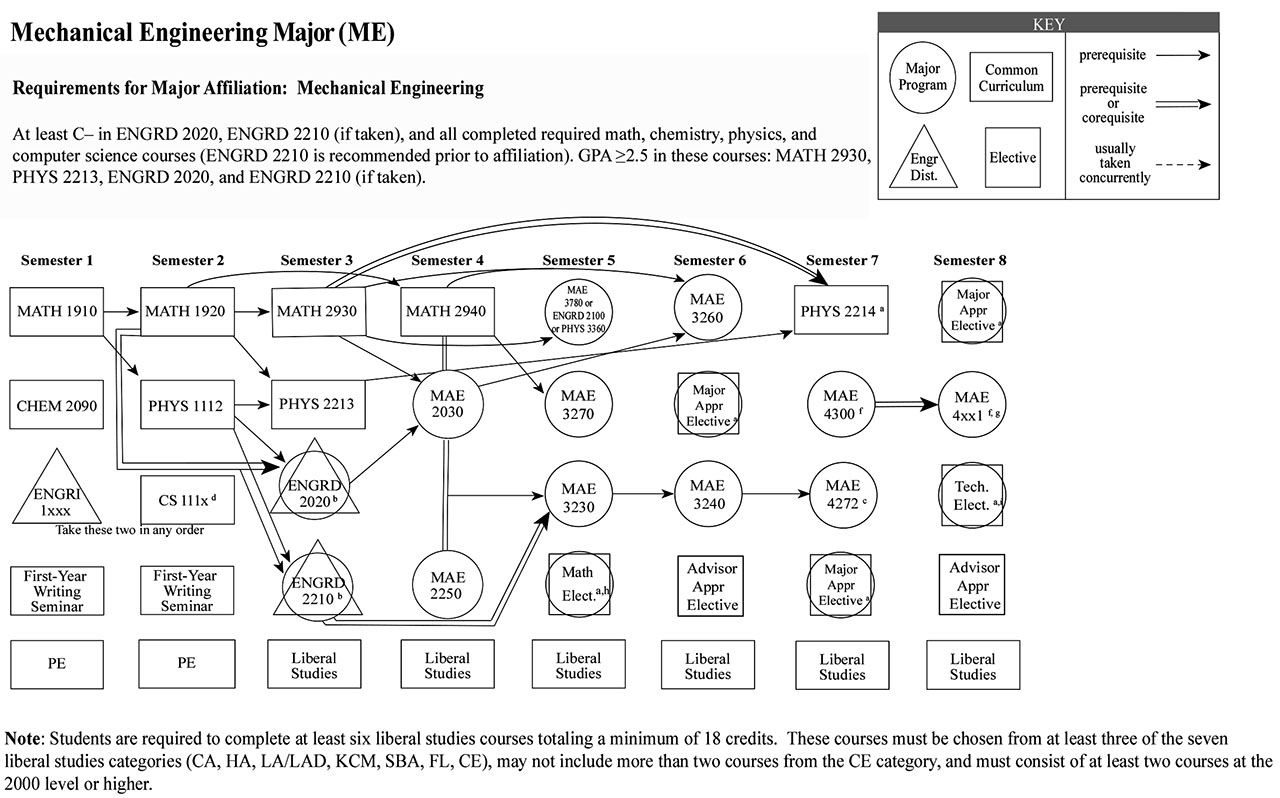
Above I have attached an example flowchart from the Cornell Engineering Undergraduate Handbook for students entering in Fall 2019. It is immediately clear that the graph above follows many of the concepts that we have discussed in class. Firstly, this flowchart is an example of a directed graph, because the edges are denoted as arrows indicating an order. Secondly, this graph is made of many subgraphs (parts of the graph not connected to any other part). It should also be noted how the graph displays different types of nodes and edges. Instead of in class where we talked about edges being labelled as strong/weak or positive/negative, this graph’s edges provide information about prerequisites and corequisites. We did not talk about different types of nodes in class, but it is a natural extension as shown in the above graph. Distinguishing the nodes increases the readability of the graph.
It is very interesting for me to view these major flowcharts through a “networks lens”. I have been looking at them very consistently since I have arrived here at Cornell but have never thought of them as graphs. This makes me wonder what other information I can reproduce into a graph to make its readability easier.
Source: https://www.engineering.cornell.edu/students/undergraduate-students/curriculum/engineering-undergraduate-handbook