Cornell Cooperative Extension and PRO-DAIRY farm business management educators work closely with dairy operators to complete Cornell University’s Dairy Farm Business Summary and Analysis Program (DFBS) on an annual basis. The DFBS is open to any dairy farm that wishes to participate, and participation is voluntary and confidential.
This article summarizes 2022 DFBS results compared to 2021 for dairy producers from ten counties across Central New York and the Southern Tier: Broome, Cayuga, Chenango, Cortland, Madison, Oneida, Onondaga, Schuyler, Tioga, and Tompkins. Thirty-six dairy farms from this region completed the DFBS in 2022, and 34 of those same farms also completed the DFBS in 2021. Dairies selling organic milk are not included in this sample.
Farm Size & Production Yields
In 2022, the 34 dairies that completed the summary in both years reported an average herd size of 1,085 cows, an increase of 3% from 2021. Herd size ranged from fewer than 241 cows to more than 2,135 cows. Farms raised fewer heifers, on average, with a ratio of 0.75 heifers per cow in 2022, down 4% from the previous year.
Average milk sold per farm was 30.3 million pounds in 2022, a 3% increase over 2021. This growth in milk sales at the farm level was driven mostly by the increase in herd size, as milk production per cow remained relatively stable. Farms sold an average of 27,940 pounds per cow in 2022, up just 93 pounds or 0.3% from the previous year.
Average tillable crop acres per farm rose from 1,895 acres in 2021 to 1,950 acres in 2022, an increase of 3%. On average, dairy producers saw hay yields decrease by 15% and corn silage yields decrease by 5%, reflecting the drier growing conditions across the region in 2022.
Farm Labor
While average herd size and tillable crop acres both grew by 3%, the average amount of labor used on these dairies increased by just 1% to 20.7 full-time worker equivalents (FTE) in 2022. As a result, this group of farms achieved gains in labor efficiency measures. The average number of cows per worker was 52.4 in 2022, up 2% from the previous year. Milk sold per worker also increased by 2%, from 1.43 million pounds in 2021 to 1.46 million pounds in 2022.
Hired labor continues to be the second largest production cost on New York dairy farms, and it rose again in 2022. Farms spent $51,688 per FTE, on average, up 6% from 2021. The increase in labor efficiency offset some, but not all, of the higher cost per worker. The cost of hired labor per unit of milk production rose 4%, from $2.95 per hundredweight in 2021 to $3.07 per hundredweight in 2022.
Milk Price & Income Generation
Farms reported an average gross milk price of $27.34 per hundredweight in 2022, up $7.39 per hundredweight or 37% from 2021. Gross milk sales averaged $7,640 per cow in 2022, up $2,085 per cow from the previous year. Accrual revenue from dairy cattle, dairy calves, and other livestock averaged $426 per cow in 2022, up 18% from the previous year. In contrast, accrual crop sales fell 35% to $163 per cow in 2022, driven by lower crop yields. Miscellaneous receipts, the income category that includes government payments and all other sources of operating income, rose just 2% in 2022 to $154 per cow. Overall, these dairies generated average total operating revenue of $8,383 per cow, or $30.00 per hundredweight, up 32% from 2021.
Cost Control
Dairies reported higher expenses across most cost categories in 2022, mirroring the relatively high inflation rates affecting the broader U.S. economy. On a per hundredweight basis, the total farm operating expense (before depreciation) rose 15%, from $19.12 in 2021 to $22.04 in 2022.
Purchased grain and concentrates, the single largest expense category for New York dairy farms, was $7.56 per hundredweight in 2022, up 16% from the previous year. Farms recorded an average milk marketing expense of $1.66 per hundredweight in 2022, up 15% from 2021. High fuel prices in 2022 drove fuel costs up by 74% to $0.87 per hundredweight. Crop expenses also rose in 2022. The average total cost of fertilizer, seed, spray, and other crop expenses was $1.57 per hundredweight, up 34% from the previous year. The average interest expense rose 25% in 2022, up to $0.50 per hundredweight, reflecting higher interest rates. Utilities, which include farm electricity and heating fuels, rose by 20% in 2022, up to $0.44 per hundredweight. The only operating expense categories that declined on a per hundredweight basis in 2022 were livestock professional fees, including milk testing (down 11%), purchased forages (down 6%), and property taxes (down 4%). Together these three cost categories accounted for an average savings of $0.05 per hundredweight in 2022.
The total economic cost to produce milk, which includes operating costs plus depreciation and the opportunity costs of owner labor and capital, increased 17%, on average, from $20.30 per hundredweight in 2021 to $23.66 per hundredweight in 2022. Despite this increase, the average milk price of $27.34 per hundredweight exceeded the average total cost of production for this sample of farms.
Net Farm Income & Return on Investment
Net farm income is a key measure of farm profit. Before appreciation, net farm income averaged $1.89 million per farm in 2022, which is equivalent to $1,740 per cow or $6.23 per hundredweight. This represents a 218% increase in net farm income compared to the previous year. Average net farm income for the same group of farms in 2021 was $593,468 per farm, $563 per cow, and $2.02 per hundredweight.
Return ratios provide information about how well a business generates returns relative to the investment in the business. Rate of return on equity (ROE) measures the annual return as a percentage of the company’s equity capital, while rate of return on assets (ROA) measures the annual return as a percentage of the total capital investment. Both measures account for the full economic cost of operator labor and management. Excluding appreciation, the average ROE was 15.3% in 2022, compared to 3.9% in 2021. The average ROA rose to 11.9% in 2022, compared to 3.6% in 2021. Higher ratios indicate larger returns per dollar invested, which implies stronger financial performance.
Final Thoughts
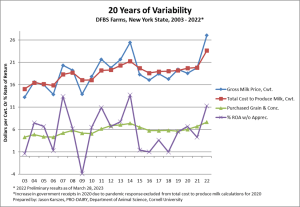
Despite widespread cost increases, dairy farms in Central New York experienced strong financial performance in 2022 driven by high milk prices. In fact, preliminary DFBS data from the entire state show that 2022 was the most profitable year since 2014, on average, for New York dairy farms participating in the DFBS (Figure 1). Dairies that built up working capital in 2022 will be in a stronger position to handle the declining milk prices and tightening margins that the industry has so far experienced in the first half of 2023.
However, not all dairies performed equally well in 2022. Some dairies were more successful than others due to variation in business models, resources (including rainfall), and management strategies. This is evidenced by a relatively large range in the total economic cost to produce milk. Of the 36 Central New York dairies that completed in DFBS in 2022, the total cost of milk production averaged $21.26 per hundredweight for the top 20%, while the bottom quintile averaged $31.04 per hundredweight. This difference in cost structure of nearly $10 per hundredweight is much larger than the reported range in milk price. As a result, these farms exhibited a large range in the rate of return on assets. In 2022, the most profitable 20% of dairies in our sample reported an average ROA before appreciation of 17.5%, compared to an average ROA of 0.4% for the least profitable quintile.
Tracking financial performance over multiple years is important, as individual farm performance in any given year may be influenced by extraordinary circumstances. However, farms with consistently high production costs and low earnings may need to assess their business strategy and make changes to control costs, increase revenues, and improve asset utilization to achieve long-term business and family goals.
Figure 1. Twenty Years of Variability in Milk Price, Cost of Production, Purchased Grain Expense, and Rate of Return on Assets for New York Dairies in the DFBS.
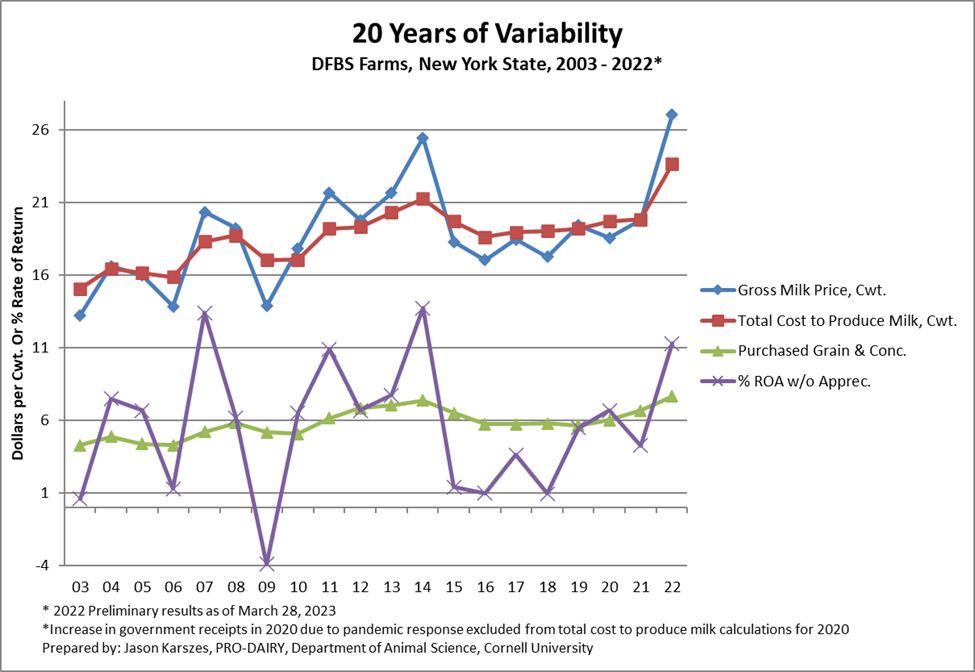
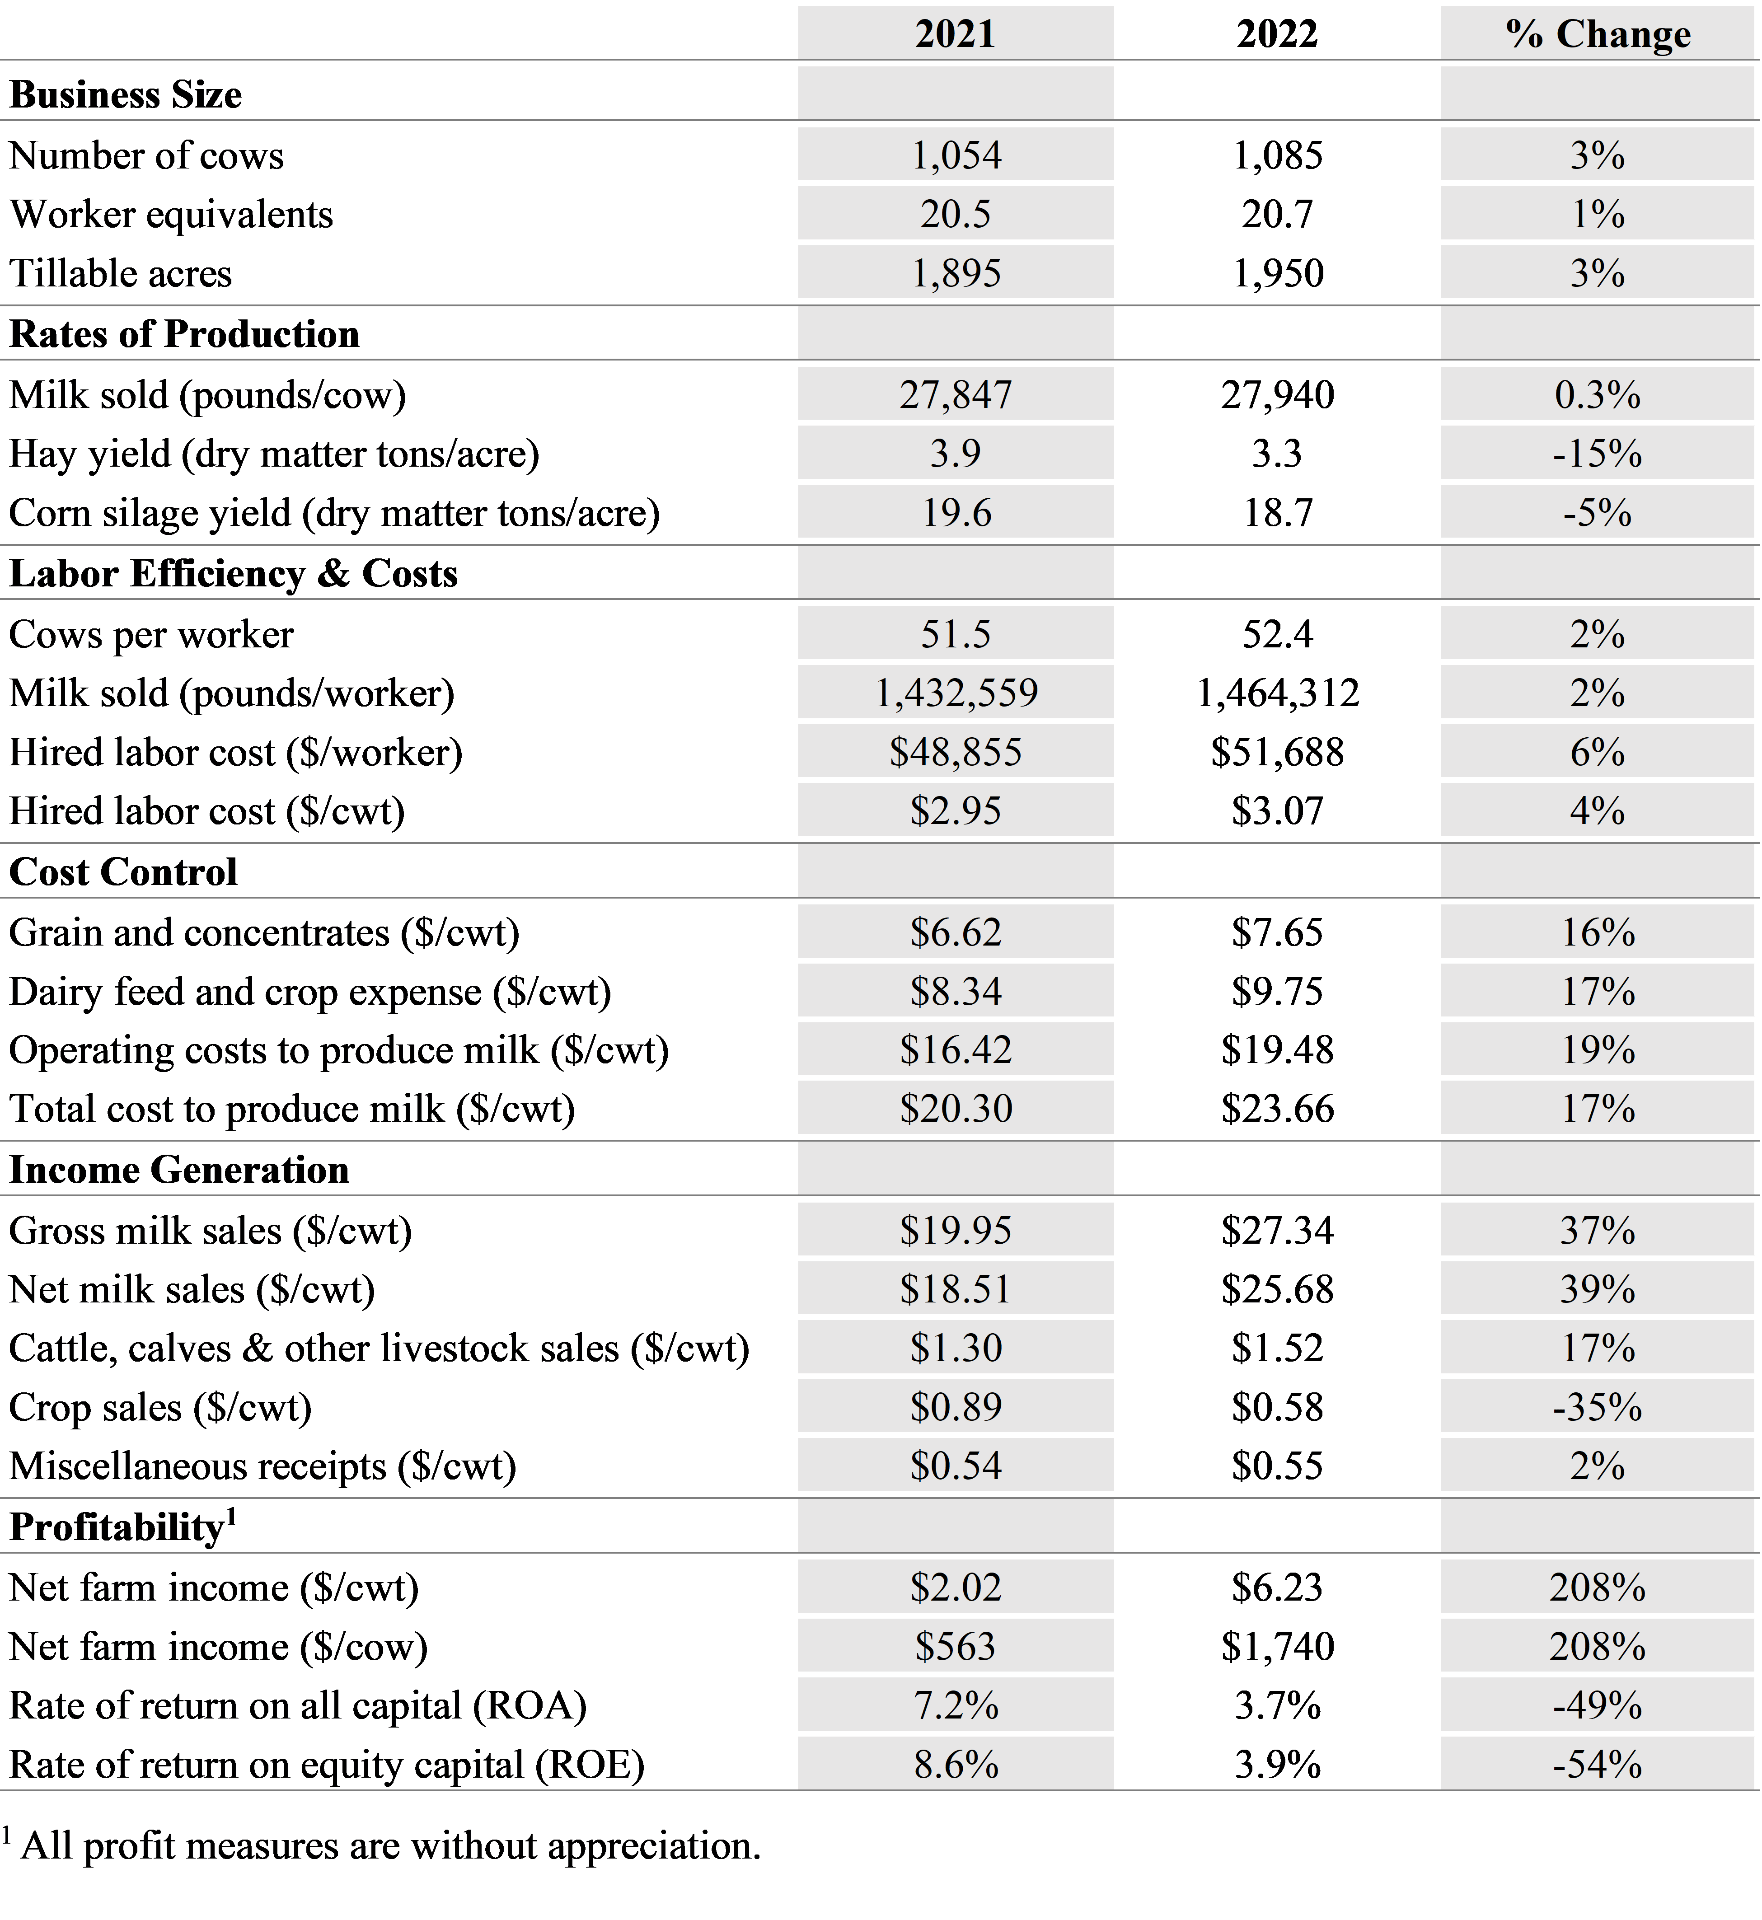
Table 1. Average values and percent change for selected financial and production metrics from the same 34 Central New York dairy farms in 2021 and 2022.