When will your corn be ready?
There was early planting and late planting this year and maturity in the field is following suit. Sixty days is the length of time, on average, that it takes for corn silage to mature from silking (pollination) to black layer (physiological maturity). We use 1/2 milkline as the indicator to start checking whole plant moisture.
Typically, in a dry year whole plant moisture runs dryer than milk line alone would indicate. At 1/4 milkline, we expect DM to be about 35%. Seventy percent moisture is the long-term accepted target for beginning harvest for bunks, but consideration needs to be given to your farm storage. Nutritionists are encouraging targeting higher dry matters to increase starch levels. It’s a balancing act to strike the DM where you can pack well and preserve maximum nutrients. Bunk silos pack better at the top of the range, while uprights may have excessive seepage above 68% moisture (Table 1).
Table 1. Target crop dry matter (DM) levels for vertical silage systems
| Oxygen limiting structure | |
| Corn silage | 40-65% DM [35-60% moisture] |
| Conventional Concrete & Stave Structure | |
| Corn Silage : | |
| Under 60 feet | 32-36% DM [64-68% moisture] |
| Over 60 feet | Increase 2% DM per 10 ft vertical height |
| Source: Management of Tower Silos by Mike Hutjens. In Silage Management: Technical Guide. | |
Whole plant dry matter samples will run 2 to 3 points above actual field conditions (that is the field will be wetter). Knowing the maturity of your crop and how many days or weeks it takes to harvest allows you to target the moisture for when to start harvest (Table 2). Moisture will decrease by 0.5 to 1.0 points per day, which is weather dependent.
Table 2. Influence of corn maturity on grain yield, whole plant silage yield, and moisture content
| % Max Yield | % Moisture | |||||
| Maturity Stage | Avg cal Days To Maturity | GDU to Maturity | Grain | Whole Plant | Grain | Whole Plant |
| Silk | 50 – 55 | 1,100 – 1,200 | 0% | 50% – 55% | — | 80% – 85% |
| Blister | 40 – 45 | 875 – 975 | 0% – 10% | 55% – 60% | 85% – 95% | 80% – 85% |
| Late Milk | 30 – 35 | 650 – 750 | 30% – 50% | 65% – 75% | 60% – 80% | 75% – 80% |
| Early Dent | 20 – 25 | 425 – 525 | 60% – 75% | 75% – 85% | 50% – 55% | 70% – 75% |
| Full Dent (1/2 Milkline) |
10 – 15 | 200 – 300 | 90% – 95% | 100% | 35% – 40% | 65% – 70% |
| Blacklayer | 0 | 0 | 100% | 95% – 100% | 25% – 35% | 55% – 65% |
| Assumes 20 GDU/day to maturity. Adapted from Carter, P.R. 1993. Pioneer Hi-Bred International, Inc.. | ||||||
Where are we with Growing Degree Days (GDD) this season?
I ran GDD totals from May 1 to August 14 for 4 representative sites across the region: Auburn, Freeville, Waverly, and Whitney Point. The data is summarized from official weather stations. Unfortunately, the Waverly station had missing data for 11 days in July and 4 days in August. I used the average daily accumulation for the missing days for each of the two months to calculate the monthly totals.
Using the Climate Smart Farming Growing Degree Day Calculator, we can estimate how the season will progress. As a general benchmark, I’m using 2000 GDD as the target for reaching harvest. Your harvest timing will need to be adjusted for your maturity groups. You can use this calculator for the fields on your farm. You select them on map and the program provides the graph predicting season GDD accumulations.
The following graphics show the predicted dates to reach 2000 GDDs across the four selected locations.
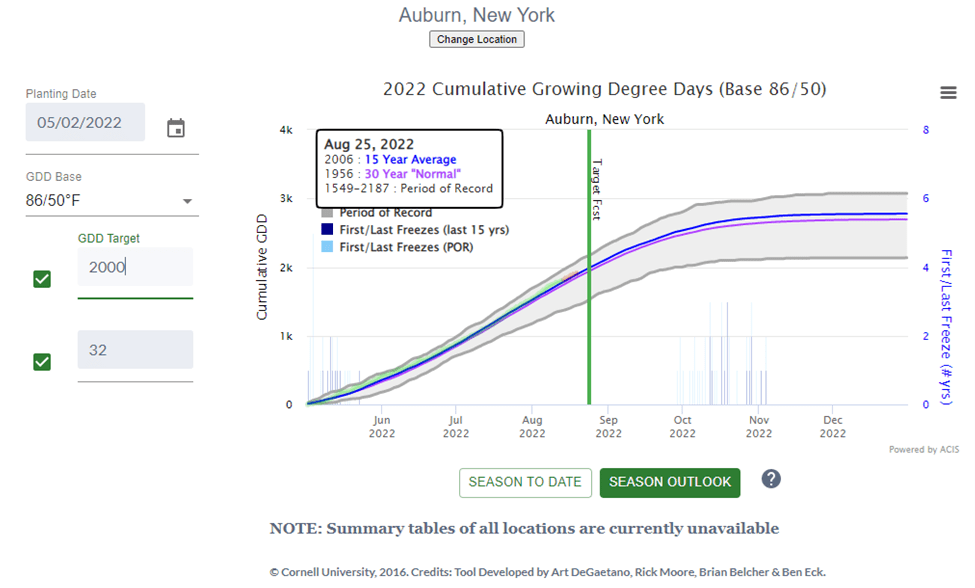
Location 1: Auburn
Table 3. Average, total, and cumulative GDD by month for Auburn, NY
| 2022 Month | Average GDD per Day | Monthly Total GDD | Season Cumulative GDD |
| May |
12 |
370 |
370 |
| June |
15 |
462 |
832 |
| July |
21 |
657 |
1,489 |
| August* |
22 |
304 |
1,793 |
*GDDs reported through August 14, 2022
Figure 1. GDD Projection for Auburn, NY
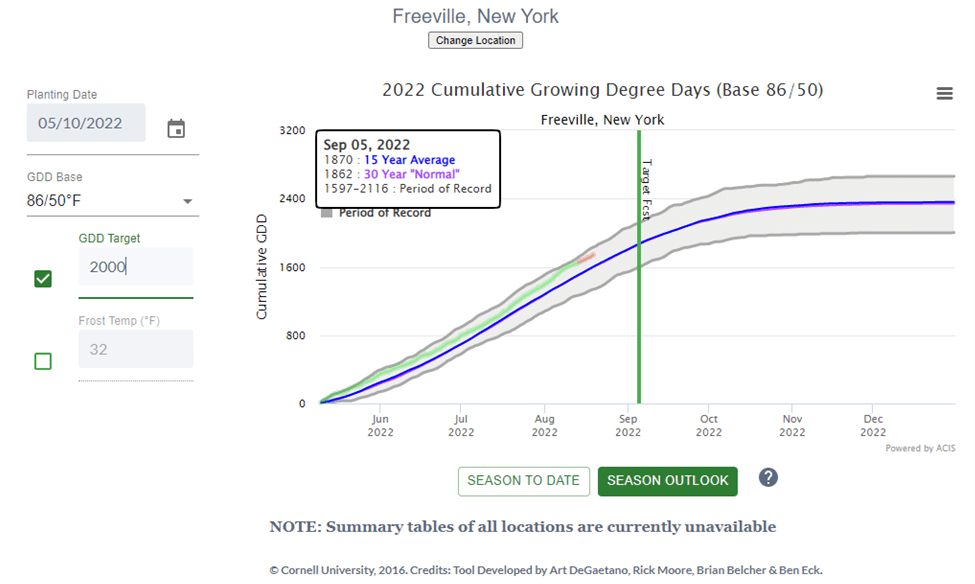
Location 2: Freeville
Table 4. Average, total, and cumulative GDD by month for Freeville, NY
| 2022 Month | Average GDD per Day | Monthly Total GDD | Season Cumulative GDD |
| May |
12 |
380 |
380 |
| June |
15 |
458 |
838 |
| July |
20 |
620 |
1,458 |
| August* |
23 |
258 |
1,716 |
*GDD reported through August 14, 2022
Figure 2. GDD Projection for Freeville, NY
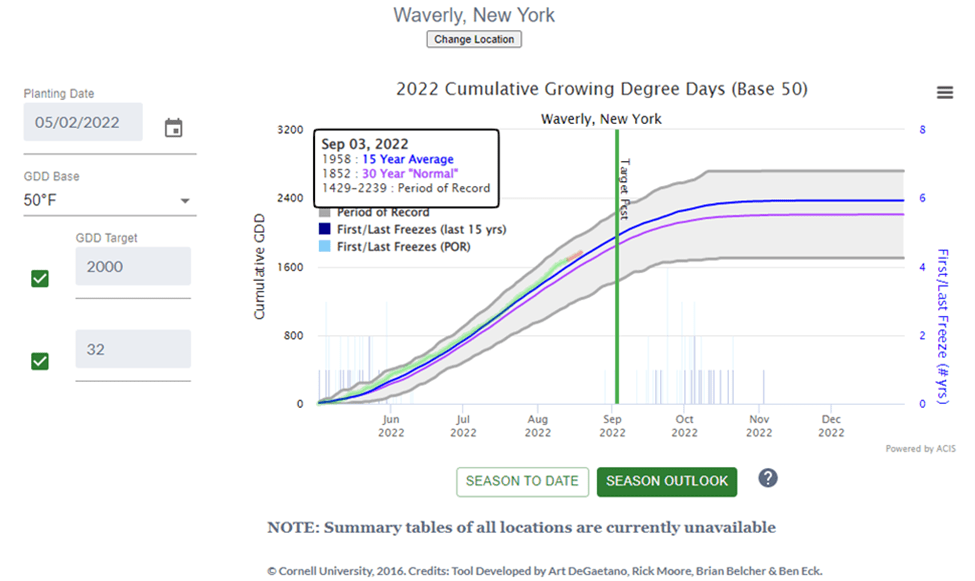
Location 3: Waverly
Table 5. Average, total, and cumulative GDD by month for Waverly, NY
| Month | Average GDD per Day | Monthly Total GDD | Season Cumulative GDD |
| May |
13 |
404 |
404 |
| June |
17 |
520 |
924 |
| July |
22 |
672 |
1,596 |
| August* |
23 |
324 |
1,920 |
*GDD reported through August 14, 2022
Figure 3. GDD Projection for Waverly, NY
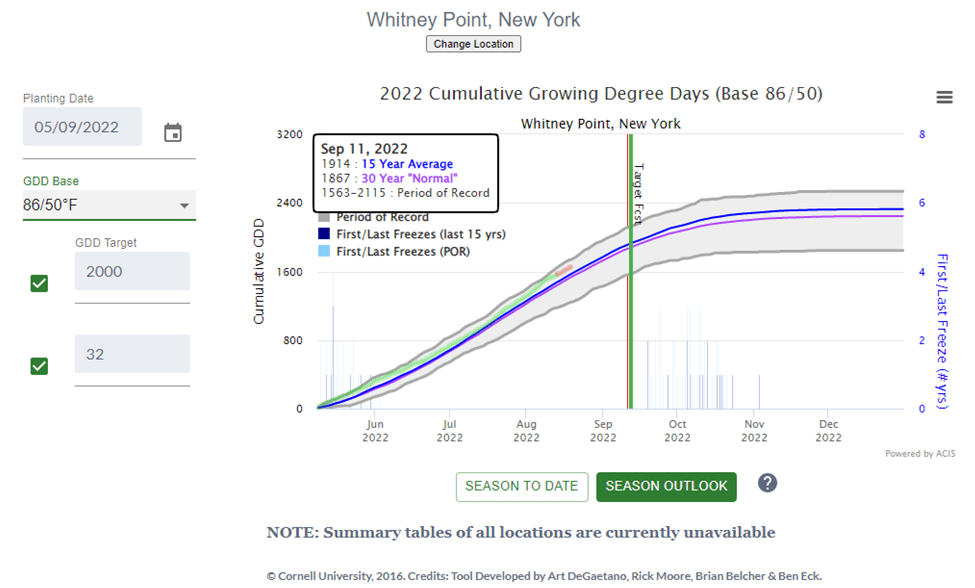
Location 4: Whitney Point
Table 6. Average, total, and cumulative GDD by month for Whitney Point, NY
| Month | Average GDD per Day | Monthly Total GDD | Season Cumulative GDD |
| May |
12 |
366 |
366 |
| June |
15 |
445 |
811 |
| July |
20 |
623 |
1,434 |
| August* |
22 |
309 |
1,743 |
*GDD reported through August 14, 2022
Figure 4.GDD Projection for Whitney Point, NY