
Cornell Cooperative Extension farm business management educators work closely with dairy operators to complete Cornell University’s Dairy Farm Business Summary (DFBS) on an annual basis. This article summarizes 2021 DFBS results for dairy producers from 11 counties across Central New York and the Southern Tier: Broome, Cayuga, Chemung, Chenango, Cortland, Madison, Oneida, Onondaga, Schuyler, Tioga, and Tompkins.
The DFBS is open to any farm that wishes to participate, and participation is voluntary and confidential. Thirty-four dairy farms from this region completed the DFBS in 2021. We have two years of performance data from 32 of those farms, which also completed the DFBS in 2020. Dairies selling organic milk are not included.
Farm Size & Production Yields
In 2021, farms reported an average herd size of 1,054 cows, an increase of 2% from 2020. Herd size ranged from fewer than 265 cows to more than 2,100 cows. The average number of heifers per farm also increased, yet the average ratio of heifers to cows remained constant at 0.80 heifers per cow.
Average milk sold in 2021 was 29.3 million pounds per farm, a 3% increase over 2020. This jump reflects the 2% increase in herd size, plus a 1% increase in milk sold per cow. Average milk sold per cow was up 335 pounds, from 27,495 pounds in 2020 to 27,830 pounds in 2021.
Average tillable acres per farm increased by 3%, from 1,810 acres in 2020 to 1,861 acres in 2021. On average, dairy producers saw hay yields increase by 22% and corn silage yields increase by 6% in 2021 compared to the prior year.
Farm Labor
Dairies reported a 1% increase in worker equivalents per farm, on average, from 20.5 in 2020 to 20.7 in 2021. Labor efficiency also increased. The average number of cows per worker was 50.9 in 2021, up 0.7%, from the previous year. Milk sold per worker increased by approximately 27,000 pounds, or 1.9%, from 1.39 million pounds per worker in 2020 to 1.42 million pounds per worker in 2021.
Hired labor continues to be the second highest production cost on New York dairy farms, and it rose in 2021. Farms paid $48,239 per worker equivalent in 2021, up 3.7% from 2020. Due to the increase in labor efficiency described above, the cost of hired labor per unit of milk production rose just 1%, from $2.92 per hundredweight in 2020 to $2.96 per hundredweight in 2021.
Milk Price & Income Generation
In 2021, farms experienced a significant increase in milk price and a drastic reduction in government payments. Gross milk sales rose 7%, on average, from $18.60 per hundredweight in 2020 to $19.99 per hundredweight in 2021. Gross milk sales averaged $5,563 per cow in 2021, up $449 per cow from the previous year.
Miscellaneous receipts, the income category that includes government payments, fell 78%, on average, from $3.00 per hundredweight in 2020 to $0.66 per hundredweight in 2021. This change reflects the extraordinarily high government receipts associated with the Coronavirus Food Assistance Program (CFAP) and other COVID-19 relief programs directed to farms in 2020 but not in 2021.
The decline in government payments more than offset the increase in milk price such that total farm operating receipts per unit of milk sold fell 1%, from $23.05 per hundredweight in 2020 to $22.91 per hundredweight in 2021. However, at the farm level, total operating receipts rose 2.4% due to the 3% increase in the total volume of milk produced. Total operating receipts averaged $6,377 per cow in 2021, up $39 from $6,338 per cow in 2020.
Cost Control
Farms reported higher expenses across many cost categories in 2021. On a per hundredweight basis, the total farm operating expense rose 7%, from $18.17 in 2020 to $19.37 in 2021. Much of the $1.20 per hundredweight cost increase stemmed from the higher cost of purchased feed, which is the largest single expense category on most dairies. In 2021, the cost of purchased grain rose $0.71 per hundredweight, while the cost of purchased forages rose $0.11 per hundredweight. Fertilizer and fuel were the next largest contributors to the overall cost increase, with fertilizer up $0.13 per hundredweight and fuel up $0.11 per hundredweight in 2021.
Only seven cost categories showed a decrease in 2021 compared to 2020. The largest cost savings came from the interest expense category, which fell $0.08 per hundredweight. Our data show a drop in the average interest rate and an increase in debt per cow in 2021, suggesting that farms may have paid off some higher interest debt and secured new debt at lower rates. Farms achieved modest cost savings in six other expense categories: land, building and fence repair; custom boarding; crop professional fees; veterinary service and medicine; milk marketing; and other miscellaneous expenses. Together these six categories accounted for a cost savings of about $0.09 per hundredweight in 2021.
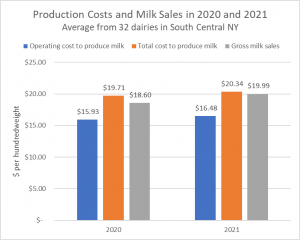
The total economic cost to produce milk, which includes operating costs plus depreciation and opportunity costs of labor and capital, increased 3%, on average, from $19.71 per hundredweight in 2020 to $20.34 per hundredweight in 2021. Notably, the total cost to produce milk exceeded gross milk sales in 2020 and 2021. This indicates that, on average, the sale of milk did not cover the full economic cost to produce milk. These numbers exclude CFAP payments, which contributed to higher total farm revenues and profits in 2020.

Net Farm Income & Return on Investment
Net farm income (without appreciation) is a key measure of profit. Net farm income averaged $584,970 per farm in 2021, which is equivalent to $555 per cow or $1.99 per hundredweight. This represents a 39% reduction in net farm income compared to the previous year. Average net farm income for the same group of farms in 2020 was $956,228 per farm, $923 per cow, and $3.36 per hundredweight. The 2020 net farm income includes almost $3.00 per hundredweight in government receipts due to payments from CFAP and other COVID-19 relief programs.
Rate of return on equity capital (ROE) and rate of return on all assets (ROA) are important measures of profitability that account for the economic cost of operator labor and management. Excluding appreciation, the average ROE was 3.9% in 2021, compared to 8.6% in 2020. The average ROA was 3.7% in 2021, compared to 7.2% in 2020. These data show that, on average, participating dairies were less profitable in 2021 compared to 2020. However, without CFAP payments and other COVID-19 relief programs, 2020 would have been a very difficult year for the dairy industry, certainly much less profitable than 2021.
Final Thoughts
Dairies across Central NY and the Southern Tier achieved increases in productivity (pounds of milk per cow) and labor efficiency (pounds of milk per worker) in 2021, both of which respond directly to management choices. These trends show positive change for operations striving to make the most of their resources and opportunities. Despite lower milk prices in 2020 compared to 2021, dairies in this region achieved higher profits in 2020 due to generous COVID-19 relief programs. Milk price and government payments had considerable influence on financial performance, yet farm managers have little control over these external factors. To survive and thrive in an industry characterized by rapid and unpredictable changes in milk price and input costs, dairy operators must focus on improving the management practices and outcomes under their influence, while considering strategies to mitigate price risk and other threats that exist beyond their control.
Table 1. Average values and percent change for the same 32 dairy farms in 2020 and 2021.
| Selected Factors |
2020 |
2021 |
% Change |
| Business Size | |||
| Number of cows |
1,036 |
1,054 |
2% |
| Worker equivalents |
20.5 |
20.7 |
1% |
| Tillable acres |
1,810 |
1,861 |
3% |
| Rates of Production | |||
| Milk sold (pounds per cow) |
27,495 |
27,830 |
1% |
| Hay yield (dry matter tons per acre) |
3.2 |
3.9 |
22% |
| Corn silage yield (dry matter tons per acre) |
19.0 |
20.2 |
6% |
| Labor Efficiency & Costs | |||
| Cows per worker |
50.6 |
50.9 |
1% |
| Milk pounds per worker |
1,390,900 |
1,417,730 |
2% |
| Hired labor cost per worker |
$46,508 |
$48,239 |
4% |
| Hired labor cost per cwt. |
$2.92 |
$2.96 |
1% |
| Cost Control | |||
| Grain and concentrates per cwt. |
$5.99 |
$6.70 |
12% |
| Dairy feed and crop expense per cwt. |
$7.46 |
$8.43 |
13% |
| Operating costs to produce milk per cwt. |
$15.93 |
$16.48 |
3% |
| Total cost to produce milk per cwt. |
$19.71 |
$20.34 |
3% |
| Income Generation | |||
| Gross milk sales per cwt. |
$18.60 |
$19.99 |
7% |
| Net milk sales per cwt. |
$17.12 |
$18.52 |
8% |
| Miscellaneous receipts per cwt. |
$3.00 |
$0.66 |
-78% |
| Profitability1 | |||
| Net farm income per cwt. |
$3.36 |
$1.99 |
-41% |
| Rate of return on all capital (ROA) |
7.2% |
3.7% |
-49% |
| Rate of return on equity capital (ROE) |
8.6% |
3.9% |
-54% |
1 All profit measures are without appreciation.
Thank you for sharing this information!