
By Betsy Hicks, CCE Dairy Management Specialist & Troy Bishopp, Upper Susquehanna Coalition/ Madison County SWCD
From May to November 2021, several farms participated in a pasture regrowth monitoring project. Troy Bishopp of the Upper Susquehanna Coalition/Madison County SWCD and Betsy Hicks of Cornell Cooperative Extension collaborated on this project, with the goal of helping graziers make mindful grazing decisions based on actual environmental measurements. Participating farms took weekly measurements of grass height and rainfall totals, which were reported along with farm elevation, growing degree days, and calculated grass regrowth rates.
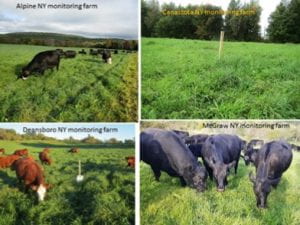
Over fifteen locations reported information early on, but four main herds participated throughout the duration of the project. Information was compiled and sent out weekly to over eighty graziers throughout NY, whether they reported monitoring information or not. While each season is unique, 2021’s conditions were very much so, and participants often shared their own grazing experiences to the wider group of people on the list. Troy’s weekly “Pasture Pontifications” gave readers a sense of what is “normal” in the grazing season as well as strategies for resiliency during the period. These weekly updates can be found on Troy’s blog at https://thegrasswhisperer.com/2021-nys-pasture-regrowth-monitoring-project/ .
The Results
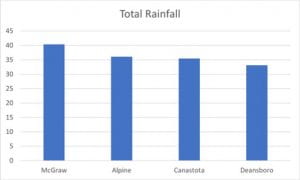
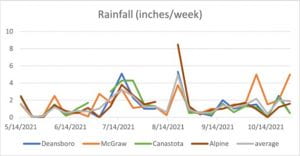
Looking at the four main locations reporting information, 2021 proved to be an unusually wet year. Through May and early June, locations appeared to be on the drier side, but that rapidly changed once July arrived. Total rainfall throughout the period for these locations averaged over 34 inches; weekly average rainfall was 1.4” and ranged from 0” to events over 8” in one week.
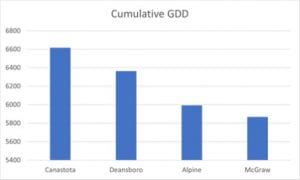
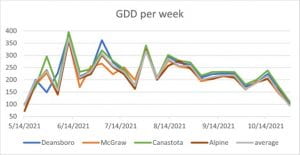
Locations also had cumulative Growing Degree Days (base 32) recorded on a weekly basis. Locations showed some variation in weekly accumulations of GDD, with the spread spanning over 100 GDD. This span was very apparent early on in the project, especially when some locations reported excellent green-up and rapid grass growth while others felt they were lagging in grass growth comparatively. By the end of the project, the four main locations reporting showed a span of almost 800 GDD difference.
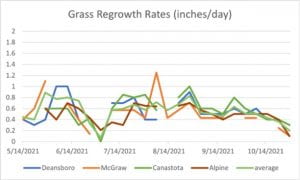
Using the weekly reported grass height, a weekly grass regrowth rate was calculated for each reporting location. As expected, growth rates early in the season averaged 0.75” per day, but started to lag as the feeling of little moisture in addition to warmer summer weather started to be experienced. After the rains started, however, regrowth rates rapidly rebounded, and continued to average over 0.6” per day through the heat of the summer. Regrowth rates stayed above 0.5” per day through early October, as GDD stayed fairly strong through the fall and ample moisture allowed grass to keep growing.
Application to 2022
The abundant grazing season of 2021 was quite forgiving if errors in grazing judgment were made. As with years past with less moisture, applying some lessons learned from the Pasture Regrowth Project can help graziers avoid judgment mistakes.
Measuring rainfall is an activity that many farmers, graziers or not, actively monitor. For graziers, though, recording this information is crucial for forage inventory planning and recovery period vetting. Keeping this simple data on a grazing chart or pasture tool along with planned rotations can hint at possible conditions that could be more difficult to graze through.
This project reached another level by including regrowth rates. The weekly grass height measurements compelled participating graziers to physically walk to the same area in a pasture to evaluate grass growth. While the act of measuring and calculating a rate is helpful, the basic action of visiting the same spot each week to compare against the week prior was very powerful.
In a dearth of rain, a weekly visit to the location can confirm that regrowth is reaching targets for a pasture rotation plan, or alert the grazier to the possibility that conditions may not allow for it and changes should be considered.
Further adding to a farm’s environmental story, tracking growing degree days relative to the week before or in comparison to other locations reveals more insight to the grazier. Spring green-up can feel different each year or in different locations in the same year. Putting a number on the warmth experienced can help graziers pinpoint differences even when the calendar says the date is the same as the year before. In addition to early season, the warmth experienced during the summer can be tallied and evaluated with the rainfall events recorded and grass regrowth monitored to give a fuller picture of how plants are responding to grazing decisions in addition to environmental conditions.
To make the best and most dynamic plan for your grazing system, graziers should regularly evaluate their pasture swards and environmental conditions, including total rainfall, cumulative growing degree days, and grass regrowth in addition to making scheduled grazing rotations using a grazing chart. 2022 is sure to be different than the past two seasons. Gathering information from the start will only help inform grazing decisions as the season progresses.
Access to grazing chart templates are available at http://www.madcoswcd.com/grazing-charts.html or contact Troy Bishopp (315) 824-9849 or troy-bishopp@verizon.net to get a paper wall chart.
If you’d like more information on this project or how to track grazing information, contact Betsy Hicks at 607.391.2673 or bjh246@cornell.edu.