
So far this season, we’ve been blessed with an actual feeling of nice spring weather. If you’re like me, though, you’re watching forage inventory with last year’s drought on your mind, and itching for this year’s hay crop to be ready to harvest, even though it’s only mid-April. With that focus, and knowing none of us have a crystal ball, I’m urging producers to keep a very close eye on cover crop they’re planning to harvest for dairy quality feed this year, along with their regular first cutting hay crop.
My goal for this year is to get producers thinking of their inventory with a critical focus on feed quality and contingency planning, especially to prepare for the possibility of another less than stellar rainfall year as well as higher feed prices that are already upon us.
Again, none of us have a crystal ball, and so I want producers to be watching their crops with a critical focus on putting quality feed in inventory.
If you follow our yearly reports of alfalfa heights for monitoring timing of first cutting, you’ll know that last year I started reporting Growing Degree Days (GDD) by location in our region along with our height report. I also reached out to John Winchell of Alltech to give me a 30,000 foot view of what he sees the season shaping up to be, compared to previous years, and he’s obliged with some really interesting maps and information that will be shared through the post below.
Growing Degree Days in the SCNY Region
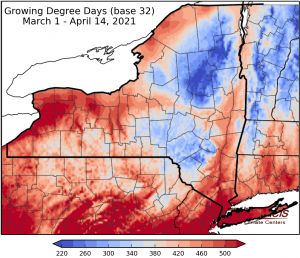
One of the first maps John shared with me is the Cumulative GDD of NY, from March 1 – April 14th, obtained from Jessica Spaccio at the Cornell Climate Center. The more red an area is, the more GDD the location has received. Areas to our west have received considerable GDD, while to our east, are a bit cooler than our region.

Looking more closely at locations in our region, see the following two pictures. GDD information shared here is obtained from the Climate Smart Farming Growing Degree Calculator, found at http://climatesmartfarming.org/tools/csf-growing-degree-day-calculator/ . Utilizing this tool, you can track GDD at your own location, B32 or B50, and input targets for accumulated GDD. Here, I’m looking at B32 for tracking our cover crop (target 800, shown) and first cutting targets (target 900-950, not shown).


As of 4/15, Jordan tops our region’s list at 500 GDD (B32), with many other top locations being in the mid-400’s belonging to Chemung and Tioga County. At the bottom of the heap in our region are many points in Cortland and Northern Broome County, some not even to 400 GDD yet.
Taking a closer look at Lansing, NY, we can see by the green line that GDD has trended over both the 15- and 30-year “normal” for 2021 by about 160 GDD. This trend has proven true to most locations in our region this year.
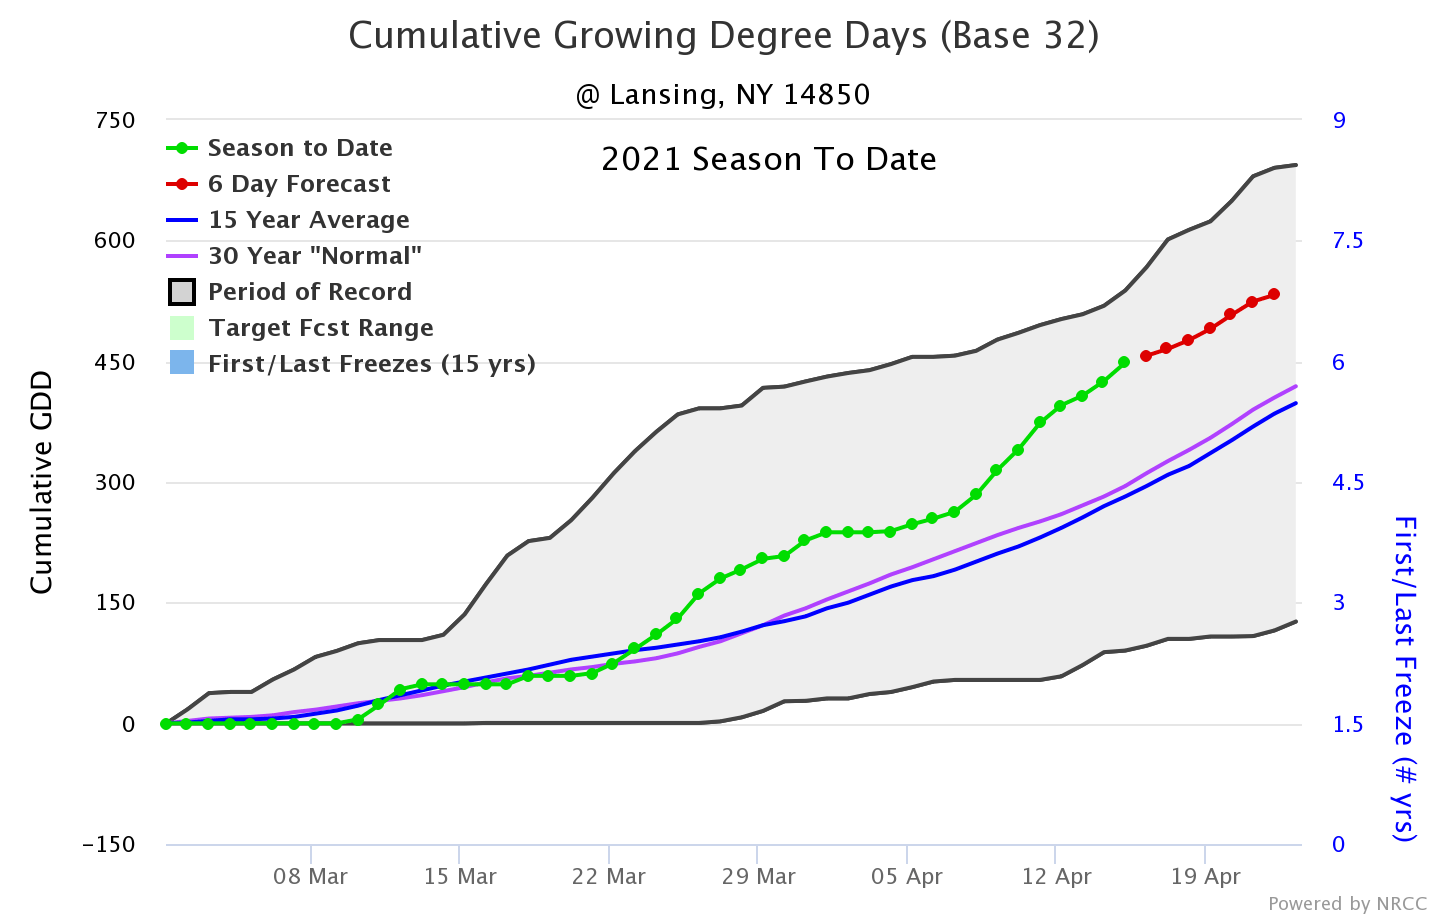

When I input a target for 800 GDD into the tool, we can see the vertical Target Forecast line hitting on May 7th. Obviously, there are quite a few weeks between then and now, but it gives us an idea for how much time we may have for gearing up for Cover Crop Harvest. Other locations in the first two pictures also give the 800 GDD target date in the final column. The tool will update daily as we progress through the season, so check back as we get further in.
What Target Should I Use?
To be sure, moisture and heat during the harvest window have a huge impact on when your crop will be ready. The information I share here is an effort to orient you to tools and numbers that you can monitor for your own area that are easily interpreted and can be verified in your own field. These numbers are guidelines only, be sure to verify your own fields before harvest!
John shares:
Typically Ryelage is earlier maturing than triticale with a shorter window for digestibility compared to NDF. Each farm situation is different depending on forage split and inventory. My list for harvest is as follows:
- I begin to pre-harvest samples at 4 inches about a week before the crop is ready, (GDD 700, B32).
- I monitor GDD forecast for the week as well as rainfall.
- I begin to chop at 750-800 GDD for ryelage and triticale respectively, if short on feed not a high amount of total ration, I will stretch it out to 850 GDD.
- After 900 GDD, the crop is usually heifer feed with an NDF of 55-60 and an NDFD30 below 60.
- I always use a homofermentative(LAB) inoculant with winter cover crops
- Length of cut is longer as winter cover crops will normally be on wetter side at harvest, to help decrease leachate
- Wide Swath and potentially ted soon on thick crops.
- Harvest DM goal is above 30% DM.
- I then look to harvest pure grass stands around 950 GDD.
So What About This Year?
Looking more macro, the following map, sent by John Winchell, shows the Spring Leaf Out Index from National Phenology Network. Looking at NY, we can see much of our state is in the red, indicating we are “early”, some areas as much as 20 days ahead of “normal”. Last year, we seemed to wait forever for grass to be ready; this year I want to be sure we’re prepared for timely harvest.

Spring is a Marathon
One last set of graphs John shared with me are below. The first graph is Lansing NY Spring GDD’s from 2010-2021. John shares, “I always say spring is a marathon, and notice the huge temperature swings in early spring for base 32. Then around 5/10 things stabilize. But the years that start really warm, typically stay ahead and finish above most average years.” The second graph is the same as the first, with the addition of lines for targeting GDD at harvest. You can see on this chart the range in harvest date to get quality feed put up. This year probably won’t be like last, so be ready to monitor field conditions as well as GDD.


Monitoring Alfalfa for First Cutting Harvest
The last two weeks of April, the team will be identifying fields to include in our annual Alfalfa Height Monitoring Project to target first cutting for peak quality of both grass and alfalfa fields. We are enlisting the help of our local county Extension Educators, so please don’t hesitate to reach out to any one of us to get us to add your fields in our weekly report, and don’t be surprised when we call asking for field ID’s!
We will be monitoring heights every Tuesday starting May 4th, with the reports coming out Wednesday mornings. Look for our first full report of Alfalfa Height on May 5th, and again, please don’t hesitate to reach out to have fields included!
I’ll send out another update for GDD next week. Until then, feel free to reach out with any thoughts or questions, and email me any cover crop heights and/or pictures you have, with location & type of crop included!