Analytical Chemistry, 2004: Microchip Dialysis of Proteins Using in Situ Photopatterned Nanoporous Polymer Membranes
Citation: Simon Song, Anup K. Singh, Timothy J. Shepodd, and Brian J. Kirby, Microchip Dialysis of Proteins Using in Situ Photopatterned Nanoporous Polymer Membranes, Analytical Chemistry, 76, 2367-2373, 2004 doi
pdf
Abstract: Chip-level integration of microdialysis membranes is
described using a novel method for in situ photopatterning
of porous polymer features. Rapid and inexpensive fabrication
of nanoporous microdialysis membranes in microchips
is achieved using a phase separation polymerization
technique with a shaped UV laser beam. By
controlling the phase separation process, the molecular
weight cutoffs of the membranes can be engineered for
different applications. Counterflow dialysis is used to
demonstrate extraction of low molecular weight analytes
from a sample stream, using two different molecular
weight cutoff (MWCO) membranes; the first one with
MWCO below 5700 for desalting protein samples, and
the second one with a higher MWCO for size-based
fractionation of proteins. Modeling based on a simple
control volume analysis on the microdialysis system is
consistent with measured concentration profiles, indicating
both that membrane properties are uniform, welldefined,
and reproducible and that diffusion of subcutoff
analytes through the membrane is rapid.
Figures:
- Figure 1. Structures of the monomer 2-(N-3-sulfopropyl-N,N- dimethylammonium) ethyl methacrylate (left) and the cross-linker methylene bisacrylamide (right).
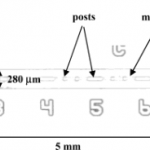
- Figure 2. Glass microchannel structure with laser-photopatterned dialysis membrane. The channel depth is 20 μm.
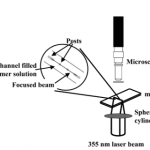
- Figure 3. Schematic of optical setup for in situ phase separation polymerization (not to scale).
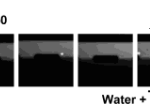
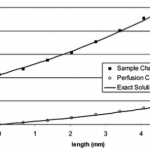
- Figure 4. Rhodamine 560 extraction in a counterflow dialysis configuration with the low MWCO membrane. The distance between the centers of the first and last images is 4.8 mm.
- Figure 5. Concentration variations of Rhodamine 560 in the sample and perfusion channels for the low MWCO membrane. The exact solutions were obtained for R ) 1.0 and ? ) 3.5. The difference in the spatial concentration gradients in the two channels is caused by differing flow rates.
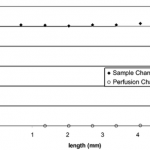
- Figure 6. LackofextractionofFITC-insulin(5700)inacounterflow dialysis configuration using the low MWCO membrane. The distance between the centers of the first and last images is 4.8 mm.
- Figure 7. Concentration variations of FITC-insulin in the sample and perfusion channel for the low MWCO membrane. In this case, k ) R ) 0.
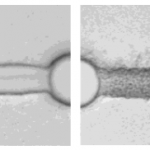
- Figure 8. Left: low MWCO membrane (deionized water:2-meth- oxyethanol ) 3.7:1). Right: high MWCO membrane (deionized water: 2-methoxyethanol ) 0.34:1). The post diameter is ∼50 μm.
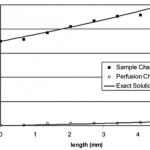
- Figure9. FITC-lactalbuminextractionbycounterflowdialysisusing the high MWCO membrane. The exact solutions were obtained for R ) 0.38 and ? ) 10. The difference in the concentration gradients in the two channels is caused by differing flow rates.
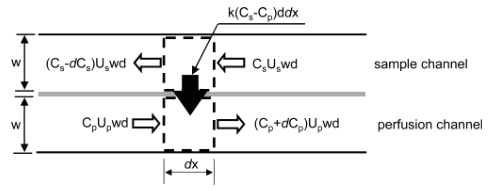
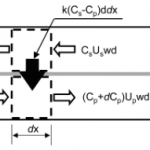
- Figure10. Concentrationfluxesforcontrolvolumesinmicrodialysis channels. The concentration on either side of the membrane is assumed uniform: C, concentration normalized by the value at the sample channel inlet; U, flow speed; w, channel width; d, channel depth; k, mass-transfer coefficient; x, distance from the perfusion channel inlet. The total length of the channel is L, and subscripts s and p indicate the sample and perfusion channels, respectively.
