Electrophoresis, 2004: Zeta potential of microfluidic substrates: 1. Theory, experimental techniques, and effects on separations
Citation: Brian J. Kirby, Ernest F. Hasselbrink Jr. Zeta potential of microfluidic substrates:
1. Theory, experimental techniques, and effects on separations, Electrophoresis, 25, 187–202, 2004 doi pdf
Abstract: This paper summarizes theory, experimental techniques, and the reported data pertaining
to the zeta potential of silica and silicon with attention to use as microfluidic
substrate materials, particularly for microchip chemical separations. Dependence on
cation concentration, buffer and cation type, pH, cation valency, and temperature are
discussed. The Debye-Hückel limit, which is often correctly treated as a good approximation
for describing the ion concentration in the double layer, can lead to serious
errors if it is extended to predict the dependence of zeta potential on the counterion
concentration. For indifferent univalent electrolytes (e.g., sodium and potassium), two
simple scalings for the dependence of zeta potential on counterion concentration can
be derived in high- and low-z limits of the nonlinear Poisson-Boltzman equation solution
in the double layer. It is shown that for most situations relevant to microchip
separations, the high-z limit is most applicable, leading to the conclusion that the zeta
potential on silica substrates is approximately proportional to the logarithm of the
molar counterion concentration. The z vs. pH dependence measurements from several
experiments are compared by normalizing the z based on concentration.
Figures:
- Figure 1. Conceptual representation of the electrical double layer at the interface of silica and a weak KCl so- lution. c, local potential; OHP, outer Helmholtz plane; u, local electroosmotic velocity. Negative surface charge stems from deprotonated silanols. Shielding of this sur- face charge occurs due to adsorbed ions inside the OHP and by mobile ions in a diffuse layer. Potential and EOF velocity profiles are shown at right. The shear plane is where hydrodynamic motion becomes possible; z is the potential at this plane. Illustration not to scale.
- Figure 2. Calculated potential distribution from Eq. (2). Similar plots for tubes and channels are available in [25–27]. u, electroosmotic speed; u0, value at infinity; c, potential; z, potential at shear plane; z*, normalized z.
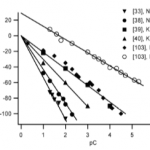
- Figure 3. Zeta potential of silica in contact with aqueous solutions plotted versus the negative logarithm of the counterion concentration (pC). Conditions: [39] pH 5.8, 257C; [40] pH 7, 307C; [38] pH 7.85, 357C; [103] pH 7, 257C; [33] pH 7, 257C.
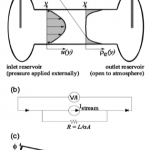
- Figure 4. (a) Experimental schematic for streaming cur- rent/potential measurements (not to scale). Electrodes through which voltage or current are measured are insert- ed into reservoirs at either end of a pressurized capillary. Velocity and charge density profiles are shown under the assumption of fully developed laminar flow. (b) Electri- cal circuit representation of the system. Overpotentials required to transfer electrons at the electrodes are rep- resented by diodes; much more complicated circuit rep- resentations (including capacitance) are also possible. (c) Actual (solid line) and apparent (dash line) potential distribution along the capillary during streaming current measurements, due to electrode overpotentials.
- Figure 5. Zeta potential meas- ured as a function of pH and counterion concentration. Top: data from Ref. [39]; bottom: data from Ref. [40]. In both cases, z is plotted normalized by pC as a function of pH. For both investigations, the z vs. pH relationship can be collapsed to a single curve over decades of counterion concentration change. Insets: plots of abso- lute z show variation if pC nor- malization is not employed.
- Figure 6. pH dependence of temperature-corrected (207C), normalized zeta potential. Filled symbols: electro- osmotic or electrophoretic mobility. Open symbols: streaming potential. For all data, the dominant cation is potassium or sodium. For clarity, results from only a few representative references are shown; additional data can be found in references listed in Table 1.
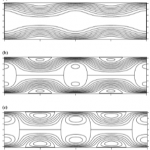
- Figure 7. Plots of the flow streamlines produced by sinusoidal variations in z in the direction of the capillary axis, produced using equations presented in [48]. (a) z = zo (11sin2px); (b) z = zo(112sinpx) (c) z = zo (114sin2px).


