The Impact of Knowledge Graphs on Search Engines.
Source: https://hitchhikers.yext.com/tracks/knowledge-graph/?_ga=2.151513841.918256792.1663606966-971625226.1663209472
The first source above is a learning platform provided by the company Yext. Yext is a tech company that utilizes this knowledge graph and develops complementary products that other companies use to improve their content-driven experience. I used this source to learn about the features and application of knowledge graphs.
Image Source: https://ahrefs.com/blog/google-knowledge-graph/
In 2012, the Google search engine underwent a huge transformation that turned a google search from looking like this:
to looking like this:

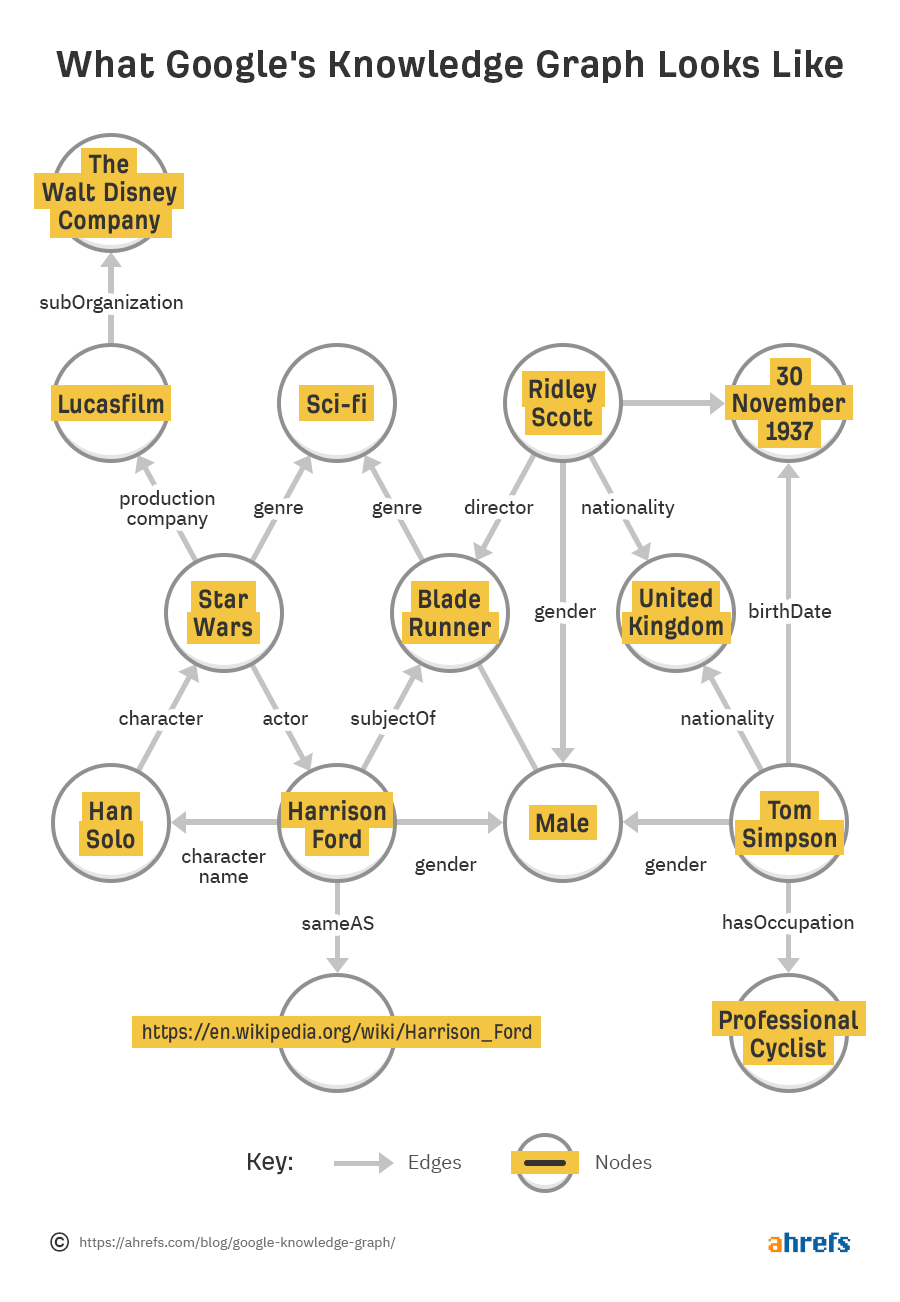
What changed was the implementation of a knowledge graph. A knowledge graph is a data source that not only stores everything as entities, such as “Harrison Ford”, “Toledo”, “Gummy Bears”, etc. but also stores relevant fields for each entity, such as “Gender”, “Location”, “Price”, “Family”, etc. Specifically, entities correspond to what the thing is, and fields correspond to how to describe the thing. Furthermore, knowledge graphs also include relationships between each entity, depending on their fields, as seen to the left. This made is so that a google search doesn’t simply produce searches by directly matching words to other words, but by matching the search to “things”. This is how the newer google search gives a direct answer to your search (“80 years” as seen above), as well as additional information, such as height, born, spouse, children, and other common searches for the entity – Harrison Ford. This emphasis on understanding the semantics of the search significantly improves the relevancy of the search results.
Improving the relevancy of search results not only impacts the process of searching general information on google, but also impacts many industries: restaurants can maintain customer engagement by maintaining a simple, yet accurate, way for customers to find the restaurant’s menu options for each location, health centers can keep their customers informed with changes in their access to care, promoters can announce events and be sure that their customers are aware of it, and much more.
In class, we learned how we can label the relationship between nodes as weak, strong, positive, or negative, providing a level of insight into the relationship between nodes. Knowledge graphs take this a step further by providing a much wider variety of possible relationships between entities. Relationships can be one-way directed, such as how a cake is “a type of” dessert, or undirected, such as how New York and California are both “states in USA”, or even two-way directed, such as how Game of Thrones is “a sequel” to House of the Dragon and House of the Dragon is “a prequel” to Game of Thrones.