Biomedical Microdevices, 2013: Enrichment of prostate cancer cells from blood cells with a hybrid dielectrophoresis and Immunocapture microfluidic system
Citation:
Huang C, Santana SM, Liu H, Bander NH, Hawkins BG, Kirby BJ. “Characterization of a hybrid dielectrophoresis and immunocapture microfluidic system for cancer cell capture”, Electrophoresis, 34:2970–2979, 2013. doi pdf
Abstract: The isolation of circulating tumor cells (CTCs) from cancer patient blood is a technical challenge that is often addressed by microfluidic approaches. Two of the most prominent techniques for rare cancer cell separation, immunocapture and dielectrophoresis (DEP), are currently limited by a performance tradeoff between high efficiency and high purity. The development of a platform capable of these two performance criteria can potentially be facilitated by incorporating both DEP and immunocapture. We present a hybrid DEP-immunocapture system to characterize how DEP controls the shear-dependent capture of a prostate cancer cell line, LNCaP, and the nonspecific adhesion of peripheral blood mononuclear cells (PBMCs). Characterization of cell adhesion with and without DEP effects was performed in a Hele-Shaw flow cell that was functionalized with the prostate-specific monoclonal antibody, J591. In this model system designed to make nonspecific PBMC adhesion readily apparent, we demonstrate LNCaP enrichment from PBMCs by precisely tuning the applied AC electric field frequency to enhance immunocapture of LNCaPs and reduce nonspecific adhesion of PBMCs with positive and negative DEP, respectively. Our work shows that DEP and immunocapture techniques can work synergistically to improve cancer cell capture performance, and it informs the design of future hybrid DEP-immunocapture systems with improved CTC capture performance to facilitate research on cancer metastasis and drug therapies.
Figures:
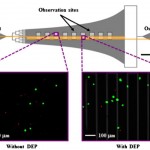
- Figure 1. Schematic of the Hele-Shaw flow cell and its interdigitated electrodes with lead connections to an applied voltage (+/-V) and ground (GND). Inset images show fluorescently labeled LNCaPs (green) and PBMCs (red) adhered to the antibody-functionalized surface with and without DEP effects. These example images show that at an applied AC electric field frequency of 350 kHz, more LNCaPs and fewer PBMCs are captured with DEP as compared to without DEP. Captured cells in each pair of 1-mm2 observation windows were enumerated and compared at a series of observation sites corresponding to a range of shear stresses. Details of the device geometry and shear stress distribution are described in our previous work (Huang et al. 2013). doi pdf
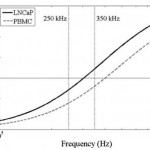
- Figure 2. Predicted DEP response, of LNCaPs (solid line) and PBMCs (dashed line) as a function of applied electric field frequency. Cells were modeled as single-shelled dielectric spheres, described by Eqs. 2 and 3. In a diluted PBS suspending medium with media conductivity = 0.07 S/m, the crossover frequency was experimentally determined to be approximately 300 kHz for LNCaPs and 400 kHz for PBMCs. These empirical measurements, combined with Eq. 3, corresponded to specific membrane capacitance values of Cmembrane = 5 mF/m2 and membrane = 7.5 mF/m2 for LNCaPs and PBMCs, respectively, in the dielectric shell model. At 250 kHz, both cell populations exhibit a nDEP response; at 350 kHz, however, LNCaPs exhibit a pDEP response whereas PBMCs still exhibit a nDEP response. Comparisons of the two frequencies’ effects on DEP-guided immunocapture are shown in Figs. 3a and 3b. doi pdf
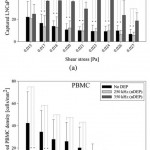
- Figure 3. Captured cell density of LNCaPs, Figs. 3a, and PBMCs, 3b, as a function of shear stress under experimental conditions of no DEP (black bars; n = 12), 6 Vpp at 250 kHz (light gray bars; n = 6), and 6 Vpp at 350 kHz (dark gray bars; n = 6). Bars represent the mean captured cell density normalized for streamline divergence in the Hele-Shaw flow cell, and error bars represent standard deviation. A Kruskal-Wallis ANOVA test was used to compare between the experimental conditions. For the LNCaP data, asterisks (*) indicate significance of differences (P < 0.05) between the 350 kHz and no-DEP conditions and between the 350 kHz and 250 kHz conditions. For the PBMC data, asterisks indicate significance of differences (P < 0.05) between the no-DEP and 250 kHz onditions and between the no-DEP and 350 kHz conditions. doi pdf
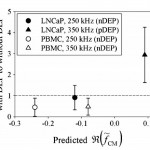
- Figure 4. Ratios of captured LNCaP and PBMC densities with DEP to without DEP effects averaged across all reported shear stresses shown in Fig. 3. Error bars represent standard error of the mean of ratios. Predicted values were taken from the single-shelled dielectric model plotted in Fig. 2. At 250 kHz, LNCaPs and PBMCs both exhibit a nDEP response, resulting in a calculated ratio less than 1 (i.e., fewer cells were captured with DEP as compared to without DEP). In contrast, at 350 kHz, LNCaPs exhibit a pDEP response that resulted in a ratio much larger than 1 (i.e., more LNCaPs were captured with DEP as compared to without DEP), whereas PBMCs still exhibit a nDEP response that resulted in a ratio less than 1. doi pdf


