Microfluidics and Nanofluidics, 2011: Integrated microfluidic preconcentrator and immunobiosensor
Citation: Kondapalli S, Connelly JT, Baeumner AJ, Kirby BJ. Integrated microfluidic preconcentrator and immunobiosensor, Microfluidics and Nanofluidics, 11(5):537-544 2011. doi pdf
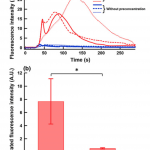
Abstract: We present a microfluidic biosensor that integrates membrane-based preconcentration with fluorescence detection. The concentration membrane was fabricated in polyacrylamide by an in situ photopolymerization technique at the junction of glass microchannels. Liposomes entrapping sulforhodamine B dye molecules were used for signal amplification. The biotin–streptavidin binding system was a model system for evaluating device performance. Biotinylated liposomes were preconcentrated at the membrane by applying an electric field across the membrane. The electric field causes the liposomes to migrate toward the membrane where they are concentrated by a sieving effect. Two orders of magnitude concentration was achieved after applying the electric field for only 2 min. The concentrated bolus was then eluted toward the detection unit, where the biotinylated liposomes were captured by immobilized streptavidin. The integrated system with the preconcentration module shows a 14-fold improvement in signal as opposed to a system that does not include preconcentration.
Figures:
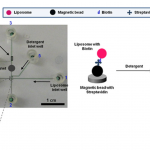
- Fig. 1 Image of the integrated glass microfluidic device used for the biotin–streptavidin experiments, with the channels filled with food dye to show contrast. The inset shows a picture of the polyacrylamide membrane-based concentrator at the junction of microchannels. Biotinylated liposomes are captured by streptavidin-conjugated magnetic beads localized at the magnet. The fluorescence from the lysed liposomes is imaged downstream from the magnet in the region marked as the fluorescence measurement window.
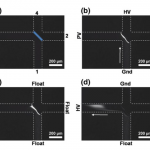
- Fig 2 Image sequence showing liposome concentration and elution. Microchannel edges have been drawn for clarity. The membrane has also been highlighted in (a). HV high voltage (100 V), PV pinch voltage (40 V), Gnd ground. (a) Before loading; (b) Sample concentration; (c) After concentration; (d) Sample elution. Pinch voltage is applied to minimize the diffusion of the sample away from the membrane
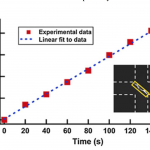
- Fig. 3 Concentration factors during liposome concentration as a function of time. The intensities were averaged over a measurement window (23 x 180 pixels) shown as a box in the inset. The concentration factors are consistent with analytical values estimated using a liposome zeta potential of -19 mV
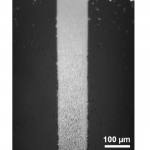
- Fig. 4 Fluorescent liposomes captured at the bead bed immobilized by a permanent magnet
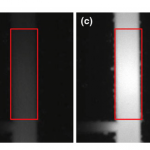
- Fig. 5 Snapshots of the fluorescence measurement window (shown as a box) during OG injection. (a) Background image before the start of injection. (b)–(d) Snapshots during fluorescence burst from the lysed liposomes during OG injection
- Fig. 6 (a) Fluorescence intensity profiles from the bead bed during OG injection for the two experiments including the preconcentration step (shown in red lines) and excluding it (shown in blue lines). b Comparison of the effect of preconcentration on the integrated fluorescence intensities from the bead bed during OG injection. The data is reported as mean ± SD with n = 3. *P < 0.05. (Color figure online)
