Phys. Rev. E, 2017: Decorrelation correction for nanoparticle tracking analysis of dilute polydisperse suspensions in bulk flow
Citation: Hartman J, Kirby BJ. Decorrelation correction for nanoparticle tracking analysis of dilute polydisperse suspensions in bulk flow, Phys. Rev. E, 95, 033305 (2017). doi
Abstract: Nanoparticle tracking analysis, a multiprobe single particle tracking technique, is a widely used method to quickly determine the concentration and size distribution of colloidal particle suspensions. Many popular tools remove non-Brownian components of particle motion by subtracting the ensemble-average displacement at each time step, which is termed dedrifting. Though critical for accurate size measurements, dedrifting is shown here to introduce significant biasing error and can fundamentally limit the dynamic range of particle size that can be measured for dilute heterogeneous suspensions such as biological extracellular vesicles. We report a more accurate estimate of particle mean-square displacement, which we call decorrelation analysis, that accounts for correlations between individual and ensemble particle motion, which are spuriously introduced by dedrifting. Particle tracking simulation and experimental results show that this approach more accurately determines particle diameters for low-concentration polydisperse suspensions when compared with standard dedrifting techniques.
Figures:
- Methods to generate PSDs used in this work. Specified PSD is a continuous probability density function generated from the summation of two log-normally distributed random variables with specified parameters and therefore is not associated with a set of displacements or any calculation of MSD. Sampled PSD contains the particle diameter values that were sampled from specified PSD in SPT simulations and therefore is associated with the discrete MSD values used to generate particle trajectories. No correction implies that observed particle trajectories were not modified in any manner. Perfect correction only considers particles’ Brownian motion and therefore represents ideal values given instrument broadening. Monodisperse correction utilizes the MSD correction factor from [26]. Both raw dedrifting and smooth dedrifting are presented in order to illustrate the effect of applying linear weighting functions to estimated non-Brownian motion. Accordingly, both raw DA and smooth DA forms are presented for clarity. Although only the x component of displacement is shown, the y component is equivalently determined and r2 = x2 + y2 is used in calculations of MSD (column 3). Individual particle MSDs were converted into suspension PSDs by using k-means clustering to initialize Gaussian mixture model fitting of multivariate distribution parameters, as described in Sec. II. A
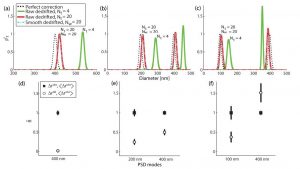
- Dedrifting causes particle number- and composition-dependent errors related to the correlation between estimated drift and particle displacement. (a)–(c) Pr is the measured probability density distribution normalized by the perfect correction. Particle size distributions represent MC-averaged (1000 iterations) distribution parameters measured from different total number particles per time step Nt or per window Nw. The magnitude of peak shift was inversely related to the number of particles defined by the ensemble and the direction of shift depended on the suspension composition. Particles were sampled equally from log-normal distributions with standard deviation = 8 nm and applied constant drift (1 um/s). (d)–(f) Here R^xy is the unbiased zero-lag cross-correlation function (9) normalized by the observed value for each peak. Data points represent the MC average ±2std in the case of Nt = 4, 2 × 10⁵ displacements per particle and no applied drift. Data points (circles) indicate whether the spurious peak shift was dominated by residual correlation (less than 1) or introduced correlation (greater than 1). The legend indicates vectors being assessed for correlation.
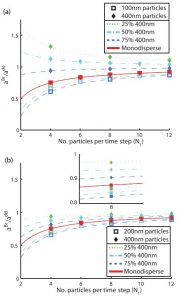
- Spurious shifts from simulated particle motion are exactly predicted analytically. Results from SPT simulations of bimodal PSDs with (a) 100- and 400-nm-diam peak means and (b) 200- and 400-nm-diam peak means are shown. The y axes are a measure of the spurious peak shifting caused by dedrifting where values greater than 1 correspond to an underestimated diameter (add < aBr), values equal to 1 have no bias (add = aBr), and values less than 1 correspond to an overestimated diameter (add > aBr). Lines represent the result of Eq. (10) given the relative number of each subpopulation that was simulated. Data points represent the average diameter ratio of the indicated size subpopulation (open square or closed diamond) calculated from ten simulations in which particles were tracked for 1e4 displacements with no bulk flow. Line color and style represent five cases corresponding to the number of small to large particles in infinity:0 (red solid line), 3:1 (green dotted line), 1:1 (cyan dot-dashed line), and 1:3 (blue dashed line) ratios. The inset in (b) zooms in on the case N = 8 in order to better visualize the agreement between analytical and simulation results. Analytically calculated bias and true bias calculated from simulated trajectories are in perfect agreement, demonstrating that Eq. (10) predicts composition-dependent error introduced by dedrifting.
- Accuracy of a single large particle in a bath of small particles. Results are from SPT simulations of N = 1 bath particles and a single large particle over a range of diameters zeta = abig/abath. Plots show (a) a broad range and (b) a practical range of zeta for vesicles. The y axes are the dedrifted diameter ratio zeta^dd = addbig/abath, while zeta indicates the true diameter ratio, thus the dedrifted ratio pproaches the known true ratio as N approaches inf. Whether values approach zeta from inf+ or inf− indicates the dominant source of error.
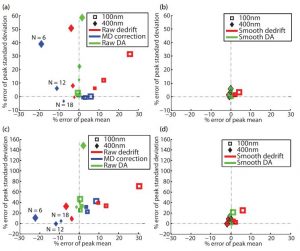
- Simulations and experiments demonstrate that DA is more accurate than dedrifting for constant, uniform bulk flow measurement conditions. Plots show the percent error of distribution parameters obtained from analysis of SPT simulations using the (a) raw estimated drift and (b) smooth estimated drift, as well as from a particle tracking experiment using the (c) raw estimated drift and (d) smooth estimated drift. Marker shape represents size mode, marker color represents the approach used for determining particle diameters, and marker size indicates the target number of particles in each time step, 6 (large), 12, or 18 (small). (a) and (b) For simulations, particle diameters were sampled from bimodal 100- and 400-nm log-normal distributions (std = 10 nm) and prescribed trajectories with a random number of time steps (between 100 and 1000) in the presence of 65-um/s bulk fluid flow (∼10 s to traverse NanoSight field of view). Plotted values represent averages from 100 simulations. (c) and (d) For experimental data, 100- and 400-nm-diam polystyrene bead standards were tracked in quiescent fluid and the number of particles in each time step was controlled in postprocessing. In both simulations and experiments, decorrelating after dedrifting obtained the lowest percent error of peak mean of all approaches for a given number of particles in each time step.
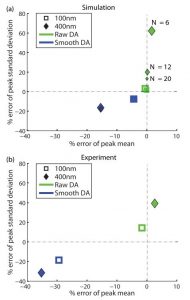
- A raw approach determined more accurate PSDs than a smooth approach in oscillatory bulk flow conditions. Plots show percent error of (a) distribution parameters obtained from DA of SPT simulations and (b) data from a particle tracking experiment in which uniform bulk flows with constant and oscillatory components were present. The frequency spectrum of applied simulated bulk flow was matched to the frequency spectrum of the experimental ensemble-average displacement time series using Fourier-transform analysis. Marker shape represents size mode, marker color represents the approach used for determining particle diameters, and, for simulations only, marker size indicates the target number of particles in each time step, 6 (large), 12, or 18 (small). In both simulations and experiments, raw DA bulk flow removal obtained the lowest percent error of peak mean of all approaches for a given number of particles in each time step. Smoothing the estimated drift time series removed true oscillatory drift such that subtracting the smooth estimated drift did not remove high-frequency bulk flow components, spuriously underestimating inferred particle diameters.
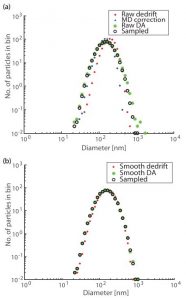
- Simulationsdemonstrate that DA is more accurate than dedrifting for a broad monomodal PSD. Plots show MC-averaged binned histograms of particle diameter obtained from analysis of SPT simulations using (a) raw estimated drift and (b) smooth estimated drift (w = 3). Particle diameters were sampled from a log-normal PSD (open circles) defined by f(x;mean = 165 nm,std = 75 nm) and prescribed trajectories with a random number of time steps between 1000 and 2000 that began at random time steps such that Nt = 4 particles. Decorrelation analysis [Eq. (12), green asterisks] is compared to standard dedrifting [Eq. (8), red marks] and to standard dedrifting with a monodisperse correction factor (blue marks) [26,31]. Plotted values represent averages from 100 simulations. The DA histogram values were nearly identical to binned sampled diameters, demonstrating high measurement accuracy regardless of particle diameter. On the other hand, current dedrifting methods both spuriously shift and spuriously narrow the PSD.


