Physical Biology, 2014: Cancerous epithelial cell lines shed extracellular vesicles with a bimodal size distribution that is sensitive to glutamine inhibition
Citation: Santana SM, Antonyak MA, Cerione RA, Kirby BJ,
Cancerous Epithelial Cell Lines Shed Extracellular Vesicles With a Bimodal Size Distribution that is Sensitive to Glutamine Inhibition, Physical Biology, 11:065001, 2014. doi pdf
Abstract: Extracellular shed vesicles (ESVs) facilitate a unique mode of cell–cell communication wherein vesicle uptake can induce a change in the recipient cellʼs state. Despite the intensity of ESV research, currently reported data represent the bulk characterization of concentrated vesicle samples with little attention paid to heterogeneity. ESV populations likely represent diversity in mechanisms of formation, cargo and size. To better understand ESV subpopulations and the signaling cascades implicated in their formation, we characterize ESV size distributions to identify subpopulations in normal and cancerous epithelial cells. We have discovered that cancer cells exhibit bimodal ESV distributions, one small-diameter and another large-diameter population, suggesting that two mechanisms may govern ESV formation, an exosome population and a cancer-specific microvesicle population. Altered glutamine metabolism in cancer is thought to fuel cancer growth but may also support metastatic niche formation through microvesicle production. We describe the role of a glutaminase inhibitor, compound 968, in ESV production. We have discovered that inhibiting glutamine metabolism significantly impairs large-diameter microvesicle production in cancer cells.
Figures:
-
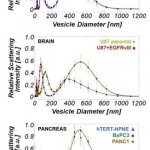
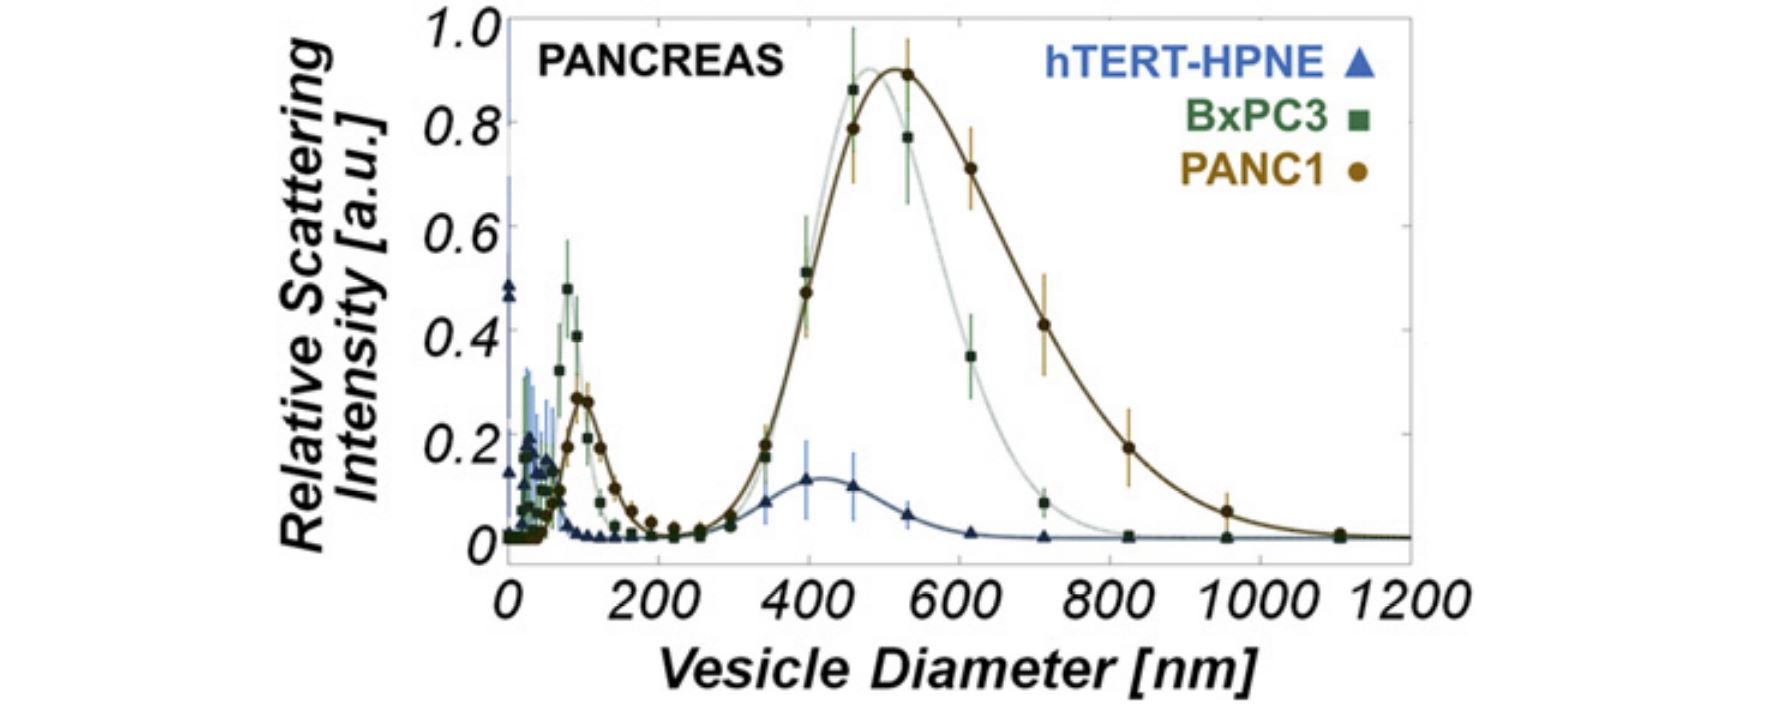
- Figure 1. Dynamic light scattering measurements reveal a bimodal vesicle population among cancer cell types examined. (a) ESV size distribution in MDAMB231 cell lines. MDAMB231 peaks are located at 73 +/- 1 nm and 413 +/- 4 nm. (b) ESV size distribution in U87 and U87+EGFRvIII cell lines. U87 peaks are located at 120 +/- 1 nm and 525 +/- 5 nm. U87+EGFRvIII peaks are located at 70 +/- 3 nm and 378 +/- 2 nm. (c) ESV size distribution in PANC-1, BxPC-3 and hTERT-HPNE cell lines. The PANC-1 peaks are located at 98 +/- 3 nm and 515 +/- 3 nm. The BxPC-3 peaks are located at 80 +/- 1 nm and 480 +/- 2 nm. The hTERT-HPNE peaks are located at 31 +/- 1 nm and 51 +/- 1 nm, and 417 +/- 11 nm. Of particular interest is the striking difference in ESV signatures between the normal pancreas cell line, hTERT-HPNE, and those of the two pancreatic cancer lines, BxPC-3 and PANC-1. Peaks at approximately 30 nm for the brain, breast and BxPC-3 (pancreas) lines are an artifact of the culture medium (RPMI-1640). All deviations from the peak locations represent those values falling within the 95% confidence interval predicted by nonlinear least squares regression. doi pdf
-
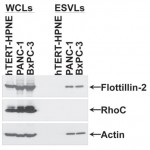
- Figure 2. Immunoblot Assay. Serum-starved hTERT-HPNE, PANC- 1 and BxPC-3 cells were lysed, and the ESVs shed into the medium by the cells were isolated and lysed as well. The whole cell lysates (WCLs) and the ESV lysates (ESVLs) were subjected to western blot analysis with antibodies against the ESV marker flotillin-2, the cytosolic-specific marker RhoC and the loading control actin. Two blank channels separate WCLs and ESVLs. doi pdf
-
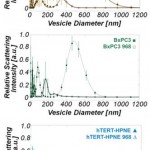
- Figure 3. Dynamic light scattering measurements demonstrate that treatment of cancer cells with compound 968 substantially reduces large-diameter microvesicle production. (a) ESV size distribution in untreated PANC-1 and 968-treated PANC-1 cells. (b) ESV size distribution in BxPC-3 and 968-treated BxPC-3 (□) cells. (c) ESV size distribution in hTERT-HPNE and 968-treated hTERT-HPNE cells. doi pdf
-
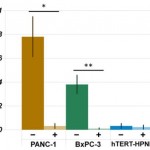
- Figure 4. Total vesicle volume analysis demonstrates that treatment of cancer cells with compound 968 dramatically reduces vesicle production in cancer cells (PANC-1, *p = 0.0006; BxPC-3, **p = 0.0002) and has no statistically significant effect on vesicle production in normal epithelial cells (hTERT-HPNE, p = 0.7). doi pdf