Soft Matter, 2012: Soft Diffuse Interfaces in Electrokinetics-Theory and experiment for transport in charged diffuse layers
Citation: Barbati AC, Kirby BJ,
“Soft Diffuse Interfaces in Electrokinetics – Theory and experiment for transport in charged diffuse layers”, Soft Matter, 8:10598-10613, 2012 doi pdf
Abstract: Charged and uncharged soft interfaces are present in a variety of microfluidic and biological systems. The electrokinetic properties of these fixed-diffuse-charge systems are dependent on (1) the components of the working fluid, (2) the bounding surface of the diffuse charge layer, and (3) the chemical and mechanical properties of the film itself. Here, we describe recent and past literature to provide a framework for the interpretation of data, utilizing the electrokinetic coupling matrix, and a description of the experimental techniques relevant for microfluidic systems. In this work, we focus on experiments on, and models for, flat surfaces with constant film mass.
Figures:
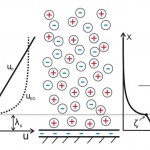
- Fig. 1 Diagram of charge-generated potential profiles at an impermeable charged interface. Bound wall charge (here negative) generates an immobile (Stern) layer of ions and a diffuse layer. Schematic potential and velocity profiles, as a result of forcing by pressure and potential fields, illustrate characteristic length scales and behaviors. The velocity profiles at left are comparable in shape but not magnitude.
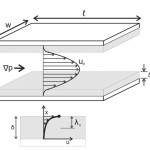
- Fig. 2 Schematic of electrokinetic cell used in theoretical modeling and experimental investigations (top). The configuration here is not drawn to scale; typically w [ d to approximate parallel plates. (Below) a typical velocity profile produced by an applied pressure difference. The hydrodynamic penetration distance, lo, is also shown.
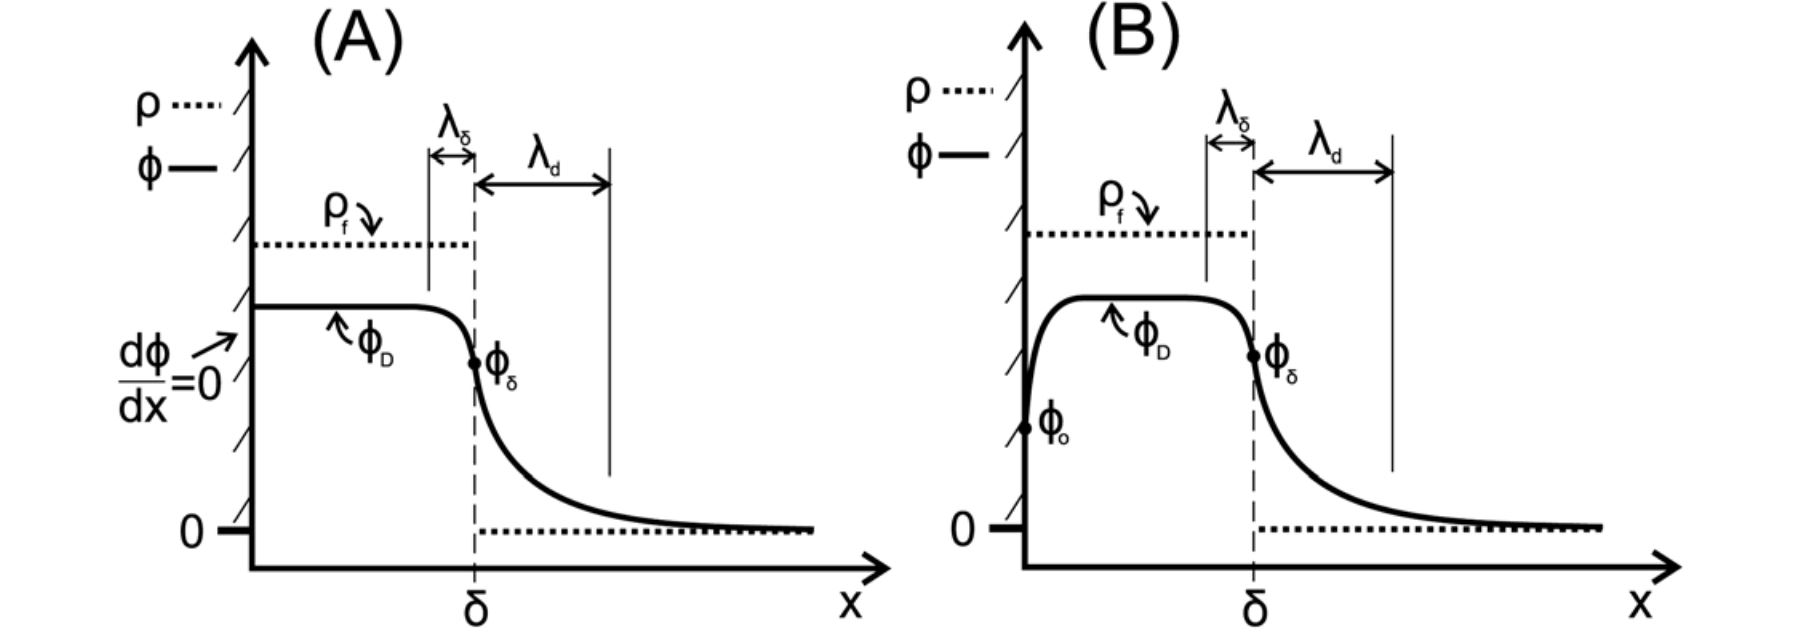
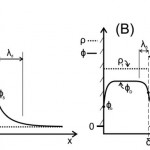
- Fig. 3 Diagrams of charge (rf) and potential (f) profiles for various wall boundary conditions. (A): Neumann boundary condition with fixed potential slope at wall. (B): Dirichlet boundary condition with fixed potential at the wall. In both cases, characteristic decay lengths are indicated for the fluid (ld) and diffuse charge layers (ld), with fd is the electrical potential at the film edge.
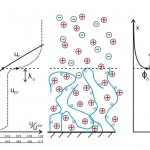
- Fig. 4 Schematic of potential and velocity profiles for a negatively charged polymer film. Various momentum and potential decay scales are displayed, which mitigate both pressure and electric field actuated transport. In the velocity–position plot at left, the up and uEO plots are not comparable in magnitude, but do indicate differences in spatial velocity gradients; pressure-driven flow changes continuously until the channel center, and local to the film varies linearly when the size of the channel is large as compared to the film thickness. The E-field generated (electroosmotic) flow establishes on scales comparable to the Debye length.
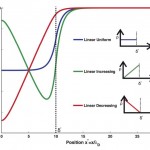
- Fig. 5 Potential profiles for various charge distributions derived from eqn (25). The film extends a distance 10ld into the domain from the wall (x* ¼ 0). The inset figures (at right) show the various charge distributions, r, considered. In all cases, the total charge is conserved across the film of thickness d* .
