PLos One, 2012: Functional Characterization of Circulating Tumor Cells with a Prostate-Cancer-Specific Microfluidic Device
Citation: Kirby BJ, Jodari M, Loftus M, Gakhar G, Pratt ED, Chanel-Vos C, Gleghorn JP, Santana SM, Liu H, Smith JP, Navarro VN, Tagawa ST, Bander NH, Nanus DM, Giannakakou PA,
“Functional Characterization of Circulating Tumor Cells with a Prostate-Cancer-Specific Microfluidic Device”, PLoS ONE, 7(4): e35976, 2012. doi pdf
Abstract: Cancer metastasis accounts for the majority of cancer-related deaths owing to poor response to anticancer therapies.
Molecular understanding of metastasis-associated drug resistance remains elusive due to the scarcity of available tumor
tissue. Isolation of circulating tumor cells (CTCs) from the peripheral blood of patients has emerged as a valid alternative
source of tumor tissue that can be subjected to molecular characterization. However, issues with low purity and sensitivity
have impeded adoption to clinical practice. Here we report a novel method to capture and molecularly characterize CTCs
isolated from castrate-resistant prostate cancer patients (CRPC) receiving taxane chemotherapy. We have developed a
geometrically enhanced differential immunocapture (GEDI) microfluidic device that combines an anti-prostate specific
membrane antigen (PSMA) antibody with a 3D geometry that captures CTCs while minimizing nonspecific leukocyte
adhesion. Enumeration of GEDI-captured CTCs (defined as intact, nucleated PSMA+/CD452 cells) revealed a median of 54
cells per ml identified in CRPC patients versus 3 in healthy donors. Direct comparison with the commercially available
CellSearchH revealed a 2–400 fold higher sensitivity achieved with the GEDI device. Confocal microscopy of patient-derived
GEDI-captured CTCs identified the TMPRSS2:ERG fusion protein, while sequencing identified specific androgen receptor
point mutation (T868A) in blood samples spiked with only 50 PC C4-2 cells. On-chip treatment of patient-derived CTCs with
docetaxel and paclitaxel allowed monitoring of drug-target engagement by means of microtubule bundling. CTCs isolated
from docetaxel-resistant CRPC patients did not show any evidence of drug activity. These measurements constitute the first
functional assays of drug-target engagement in living circulating tumor cells and therefore have the potential to enable
longitudinal monitoring of target response and inform the development of new anticancer agents.
Figures:
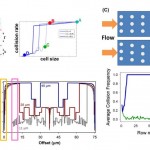
- Figure 2. GEDI microfluidic device-results in cell lines recapitulate simulations. (A) Left: Top view of microfluidic obstacle array with array geometric parameters. D= obstacle offset. L = obstacle spacing in the direction of bulk flow. C= obstacle spacing in the direction orthogonal to bulk flow. 2r = obstacle diameter. Streamlines (gray) denote fluid flow. Pathlines (various colors) denote trajectories of cells of different diameters. Obstacle array spacing and orientation parameters are also defined. Right: The rate of cell-wall collisions for cells traveling through the array is a strong function of the offset parameter of the array; the GEDI design methodology implies use of an offset parameter that leads to size-dependent collision rates. The results predicted for the flow through the geometry at left are shown at right by the solid line; the four specific cell sizes lead to results denoted by the four colored dots on this graph. Other geometric arrangements lead to different results, shown at right in the dotted and dashed lines. (B) Straight arrays or arrays with small offsets (gold boxes) lead to lower capture efficiency (left) and size independence (right). Carefully chosen offsets (magenta boxes) lead to high capture rates (left) and size dependence (right). Capture rates at left compare GEDI (7-mm offset) and straight (no offset) geometry performance as measured by LNCaP capture efficiency on J591-functionalized devices. Rates at right describe simulated collision rates in these geometries. Both experimental results have the same surface-area-to-volume ratio. (C) Devices with the same surface area to volume ratio give vastly different results: straight arrays lead to collisions that decrease as the blood travels through the device; GEDI arrays lead to collisions that increase with travel through the device. doi:10.1371/journal.pone.0035976.g002
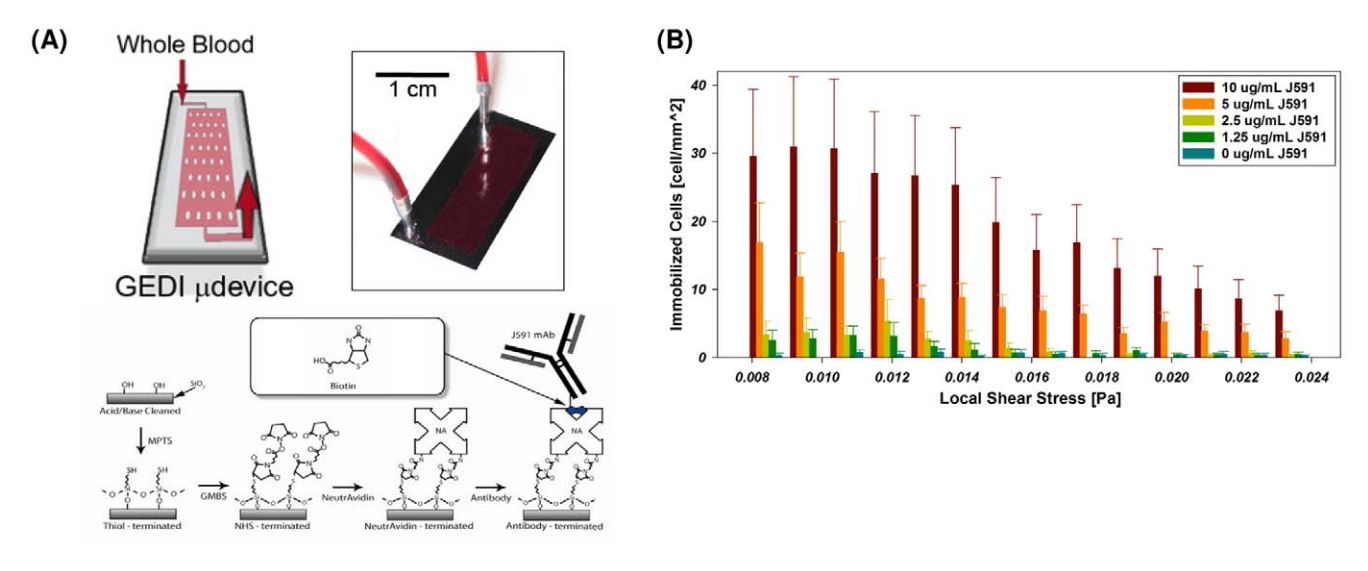
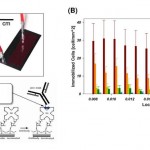
- . GEDI microfluidic device design. (A) GEDI device overview. Clockwise from upper left: schematic of blood flow through device, image of silicon device with silicone gasket, surface functionalization scheme. (B) Cell capture performance as a function of shear stress and antibody concentration. Titration curves for the anti-PSMA J591 antibody in a standardized geometry indicate optimal antibody concentration for cell capture. doi:10.1371/journal.pone.0035976.g001
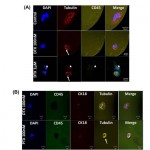
- Figure 5. On-chip assessment of effective drug-target engagement on viable GEDI-captured CTCs. Tubulin response to taxane treatment can be assessed in GEDI-captured cells. (A) C4-2 prostate cancer cells were spiked at 200 cells/ml into healthy-donor whole blood. One ml of spiked blood was then flowed in each of three GEDI devices. Captured cells were incubated on each device at 37uC for 24 hr with either DMSO control (upper panel) or DTX 100 nM (middle panel) or 1 mM (lower panel). Following drug treatment, cells were fixed and processed for immunofluorescence staining using antibodies against tubulin and CD45. DAPI was used as a DNA counterstain to evaluate nuclear integrity. Note the fine and intricate microtubule network in the DMSO control (top panel) and the distinct microtubule bundles in the DTX treated devices (arrows, middle and bottom panels). Apoptotic nuclei were observed at higher DTX concentrations (arrowhead, bottom panel). (B) GEDI-captured CTCs from the blood of a CRPC patient were treated ex vivo on the GEDI device with 100 nM DTX (top panel) or the addition of 100 nM PTX (bottom panel) at 37uC for 24 hr. Following drug treatment the PSMA-captured cells were fixed and processed for immunofluorescence staining as in (A) with the addition of cytokeratin- 18 as an alternative epithelial marker. In this patient, the presence of an unperturbed microtubule network following DTX treatment (top panel) indicates lack of efficient drug-target engagement. In contrast, addition of PTX resulted in microtubule bundling (bottom panel). doi:10.1371/journal.pone.0035976.g005
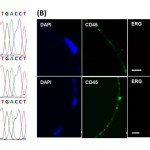
- Figure 4. Functional characterization and detection of genetic alterations in GEDI-captured cells.(A) Captured cells exhibit high purity, enabling the identification of single point mutations. The T868A (ACT-GCT; Thr-Ala) AR single-point mutation is detected from RNA extracted from 50 C4-2 cells spiked into 1 ml of healthy-donor blood and captured by the GEDI device (third row, arrow). Sequencing results from 1 ml blood from the same healthy donor (top row) or from 50 C4-2 cells in culture (middle row) are also depicted. (B) The TMPRSS2:ERG fusion protein is detected in GEDIcaptured CTCs from a CRPC patient. PSMA-captured CTCs were stained on the device with an anti-ERG antibody. Representative examples of three PSMA+/CD452 CTCs are shown, two of which are positive for ERG. Scale bars: 10 microns. doi:10.1371/journal.pone.0035976.g004
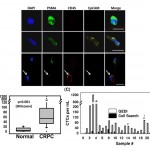
- Figure 3. CTC enumeration using the GEDI and comparison to capture by Cell Search. (A) Representative images of circulating tumor cells captured with the GEDI device from 1 mL of blood from prostate cancer patients. CTCs are imaged on the device and are identified following immunostaining with DAPI, PSMA, CD45, and EpCAM. Intact, nucleated cells that are PSMA+/CD452 are identified as CTCs. Leucocytes are identified as DAPI+/PSMA2/CD45+ (bottom row, arrow). Note the heterogeneity of EpCAM expression in the PSMA+ cell population (top and bottom rows, EpCAM-; middle row, EpCAM+). Scale bar: 10 mm. (B) Disease-specific GEDI capture of CTCs. CTC enumeration (CTCs/ml) was performed using blood from healthy donors (median = 3) and CRPC patients (median = 54). (p,.001; Wilcoxon) (C) Comparison of CTC enumeration between GEDI-basedand CellSearchH-based capture. This comparison was performed using same-day blood draws from 25 individual CRPC patients. * indicates that CellSearch-based enumeration was performed 1 week before GEDI-based enumeration; 1 indicates same patient whose blood was drawn on two separate time points three months apart (blood draw no 14 occurred 3 months after blood draw no 19); # indicates same patient whose blood was drawn on two separate time points 1 year apart (blood draw no 22 occurred 1 year before blood draw no 23). doi:10.1371/journal.pone.0035976.g003
