Microfluidics and Nanofluidics, 2009: Refolding of beta-galactosidase: microfluidic device for reagent metering and mixing and quantification of refolding yield
Citation: Kondapalli S, Kirby BJ. Refolding of beta-galactosidase: microfluidic device for reagent
metering and mixing and quantification of refolding yield, Microfluidics and Nanofluidics, 2009(7): pages 275–281 doi pdf
Abstract:We have developed a device that uses microfluidic
valves and pumps to meter reagents for subsequent
mixing with application to refolding of the protein
beta-galactosidase. The microfluidic approach offers the
potential advantages of automation, cost-effectiveness,
compatibility with optical detection, and reduction in
sample volumes as opposed to conventional techniques of
hand-pipetting or using robotic systems. The device is a
multi-layered poly(dimethylsiloxane) on glass device with
automated controls for reagent aliquoting and mixing.
Refolding experiments have been performed off-chip using
existing protocols on the protein b-galactosidase and the
refolding yield has been quantified on-chip using fluorescein
di-beta-D-galactopyranoside, a caged-fluorescent molecule.
This work provides the potential to reduce the cost of drug
discovery and realization of protein pharmaceuticals.
Figures:
-
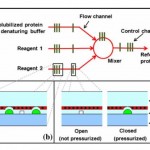
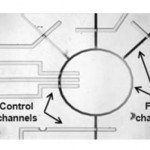
- Fig. 1 a Schematic of the channel layout showing the flow channels and control channels; b peristaltic pump action in the device; c valve action in the device
-
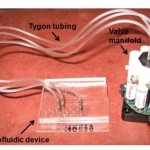
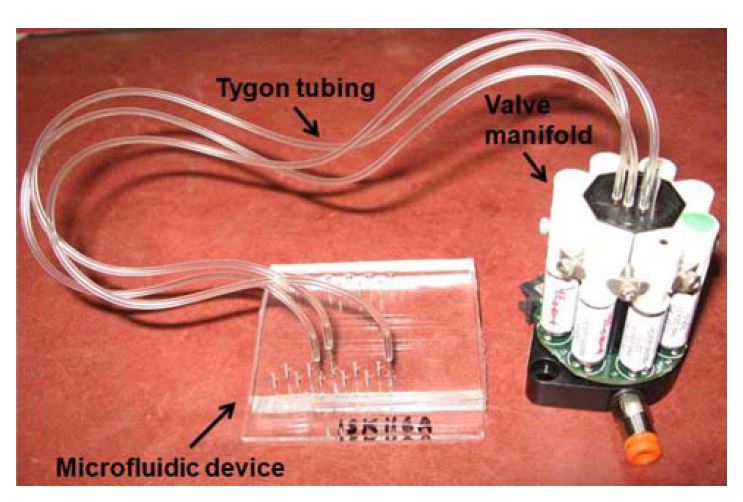
- Fig. 2 Microfluidic device integrated to an eight-valve manifold through tygon tubing. The size of the glass slide to which the PDMS layers are bonded is 2″ X 3″
-
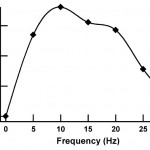
- Fig. 3 Volume injection rate in a flow channel plotted against the frequency of actuation of the control channels
-
- Fig. 4 Snapshots of the device at different times during mixing. Complete mixing is accomplished in about 45 s. The flow rate of the fluid in the mixing ring upon actuation of the peristaltic pump is 1.07 nl/s
-
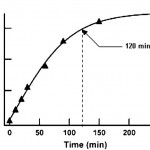
- Fig. 5 Fluorescence signal as a function of FDG–beta galactosidase incubation time. The line is a sigmoidal curve fit to the data
-
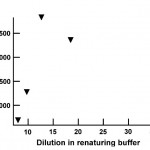
- Fig. 6 Fluorescence signal intensity plotted as a function of dilution of the solubilized protein in the refolding buffer
-
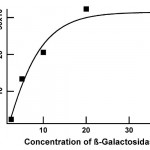
- Fig. 7 Calibration curve of beta-galactosidase concentration versus fluorescence intensity in a PDMS microchannel. The intensity is calculated by processing fluorescent micrographs of the channel
-
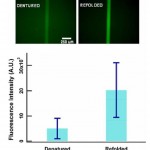
- Fig. 8 Micrograph of device filled with denatured and refolded beta-galactosidase samples. The protein samples are incubated with FDG off-chip and introduced into the microchannels to quantify the yield. The bar graph shows the fluorescent intensities of the denatured and refolded samples (n = 3)