Electrophoresis, 2005: The zeta potential of cyclo-olefin polymer microchannels and its effects on insulative (electrodeless) dielectrophoresis particle trapping devices
Citation: Mela P, van den Berg A, Fintschenko Y, Cummings EB, Simmons BA, Kirby BJ. The zeta potential of cyclo-olefin polymer microchannels and its effects on insulative (electrodeless) dielectrophoresis particle trapping devices, Electrophoresis 26:1792-1799 (2005). doi pdf
Abstract: While cyclo-olefin polymer microchannels have the potential to improve both the optical detection sensitivity and the chemical resistance of polymer microanalytical systems, their surface properties are to date not thoroughly characterized. These surface properties dictate, among other things, electrokinetic effects when electric fields are present. Here, we report the measurement of the zeta potential of cyclo-olefin polymers (injection-molded and hot-embossed Zeonor 1060R and 1020R) microchannels as a function of pH, counter-ion concentration, storage conditions, and chemical treatment in aqueous solutions both with and without EOF-suppressing additives. In contrast with previous reports, significant surface charge is measured, consistent with titration of charged sites with pKa = 4.8. Storage in air, acetonitrile, or aqueous solutions has relatively minor effects. While the source of the surface charge is unclear, chemical functionalization has shown that carboxylic acid groups are not present at the surface, consistent with the chemical structure of Zeonor. EOF-suppressing additives (hydroxypropylmethylcellulose) and conditioning in perchloric acid allow the surface charge to be suppressed. We demonstrate dielectrophoretic particle trapping devices in Zeonor 1060R substrates that show reduced trapping voltage thresholds as compared to previous implementations in glass.
Figures:
-
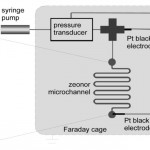
- Figure 1. Right: schematic representation of the zeta potential measurement apparatus. Left: optical microscope image of a microchannel.
-
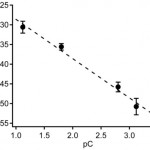
- Figure 2. Zeta potential (mean +/- SD, nm = 9, nc = 3) as a function of the negative logarithm of the counterion concentration (pC) of phosphate buffers at pH 6.8–7.0, C = 0.5–50 mM. Dashed line: linear fit.
-
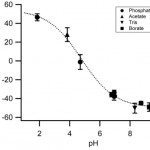
- Figure 3. Zeta potential (mean +/- SD; nm = 15, nc = 5) as a function of buffer pH. The dotted line represents a sigmoidal fit of the experimental points, indicative of titration of charged sites with pKa near 4.8. Counterion concentration, 10 mM.
-
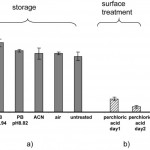
- Figure 4. Effect of storage and surface treatment on zeta potential. Abscissa indicates (a) condition in which channels were incubated for one week; (b) effect of 30 min perchloric acid incubation, measured on two sequential days; (c) results for untreated and plasma-oxidized substrates as reported by [8]. Zeta potentials (mean +/- SD, nm = 9, nc = 3) for (a), (b) were obtained with 10 mM phosphate buffer, pH 7. The data from [8] was measured at 20 mM phosphate pH 7, however, assuming dz/dlogC < 10 mV at pH 7, the difference caused by concentration differences is insignificant as compared to experimental error.
-
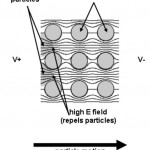
- Figure 5. Schematic depiction of the field nonuniformity and attendant particle trapping observed with insulating post arrays.
-
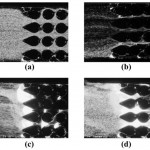
- Figure 6. Dielectrophoretic response of fluorescent polystyrene beads in a polymer device constructed entirely of Zeonor 1060r. (a)–(c): application of bulk fields of (a) 49 V/cm, (b) 392 V/cm, and (c) 980 V/cm. (d) Beads diffuse from the trapping regions when the field is removed. The electroosmotic flow direction is from left to right and is opposite to that of the electric field.