Analytical Chemistry, 2004: On-Chip High-Pressure Picoliter Injector for Pressure-Driven Flow through Porous Media
Citation: Reichmuth DS, Shepodd TJ, and Kirby BJ, On-Chip High-Pressure Picoliter Injector for Pressure-Driven Flow through Porous Media, Analytical Chemistry, 76, 5063-5068, 2004 doi pdf
Abstract: A high-pressure (>3 MPa) on-chip injector has been developed for microchip applications including HPLC. The mechanical injector is implemented using in situ photopolymerization of fluorinated acrylates inside wet-etched silica microchips. The injector allows reproducible injections as small as 180 pL with <250 ms duration. The injector operated robustly over 60 days and over 1000 injections. The injector is unique among polymer-based valves as it functions in aqueous, acetonitrile, and mixed buffers at high pressures without detectable leakage. Figures:
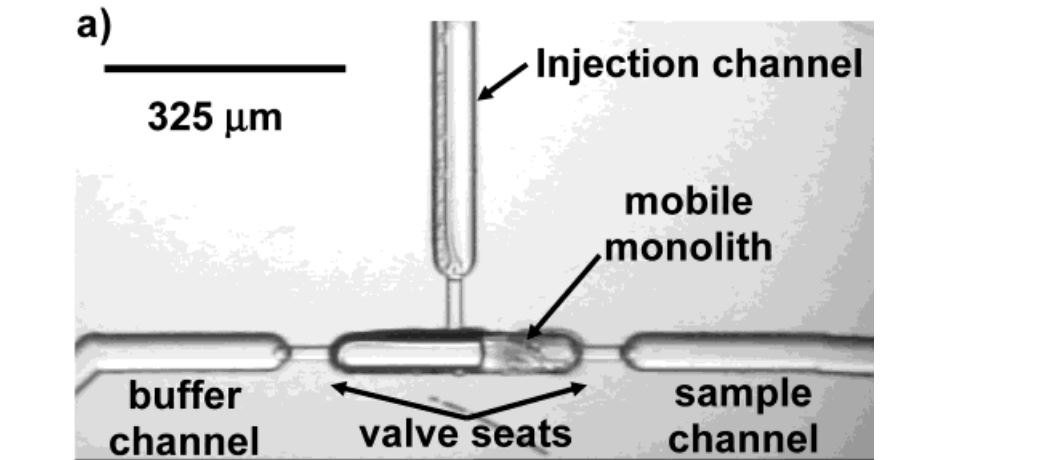
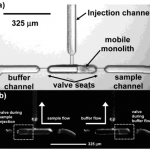
- Figure 1. (a) Micrograph of the injection valve. In the position shown, fluid from the buffer input at left travels down the injection channel at top. Sample fluid at right is isolated from the rest of the system. (b) Movement of the polymer element (mobile monolith) allows control of the fluidic pathways.
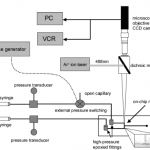
- Figure 2. Schematic of the injection quantification apparatus.
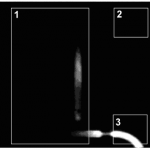
- Figure3. Micrographoftheinjectionvalvewiththeintegrationareas highlighted. The integrated signal from region 1 is due to the flow of dye solution into the injection channel and is used to calculate the injected volume. Signal measured in region 2 is used to determine background fluorescence. Region 3 comprises a known volume of sample, allowing calibration of fluorescence intensity to volume of solution injected.
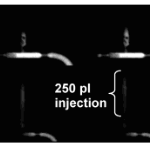
- Figure 4. Time series of a 250 pL injection. Series a shows the opening and closing of the injection valve. While the motion of the polymer element cannot be seen directly, the presence of fluorescence in the injection region is indicative of valve actuation. Series b displays the movement of the sample plug into the injection channel.
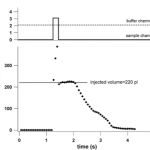
- Figure 5. Volume of sample fluid present in the valve region and injection channel during an injection cycle, indicated with diamond markers. The volume of sample fluid is calculated from the fluores- cence, as shown in Figure 3. The injection volume is 220 pL. The buffer channel (dashed line) is held at constant pressure, 2.1 MPa (300 psi). The sample channel (solid line) is pressurized to 3.1 MPa (450 psi) at 1.20 s and depressurized at 1.46 s.
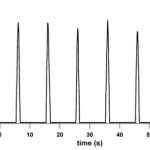
- Figure 6. Fluorescence intensity measured downstream from the valve. Injections are performed at 0.1 Hz, with a 500 ms duration. The buffer channel is held at constant pressure, 2.1 MPa (300 psi); the sample channel is pressurized to 3.1 MPa (450 psi) during injection.
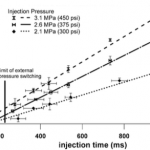
- Figure 7. Injected volume as a function of injection time and pressure. The buffer channel pressure is held constant at 1.0 MPa (150 psi) below the injection pressure. Error bars indicate the standard deviation of the injection volume and duration.
