Sensors and Actuators B, 2003: Increasing the Performance of High-Pressure, High-Efficiency Electrokinetic Micropumps Using Zwitterionic Solute Additives
Caption:
Reichmuth DS, Chirica GS, Kirby BJ, Increasing the Performance of High-Pressure, High-Efficiency Electrokinetic Micropumps Using Zwitterionic Solute Additives, Sensors and Actuators B-Chemical, 92:37-43 (2003). doi pdf
Abstract:
A zwitterionic additive is used to improve the performance of electrokinetic micropumps (EK pumps), which use voltage applied across a porous matrix to generate electroosmotic pressure and flow in microfluidic systems. Modeling of EK pump systems predicts that the additive, trimethylammoniopropane sulfonate (TMAPS), will result in up to a 3.3-fold increase in pumping efficiency and up to a 2.5-fold increase in the generated pressure. These predictive relations comparewell with experimental results for flow, pressure and efficiency. With these improvements,
pressures up to 156 kPa/V (22 psi/V) and efficiency up to 5.6% are demonstrated. Similar improvements can be expected from a wide range of zwitterionic species that exhibit large dipole moments and positive linear dielectric increments. These improvements lead to a reduction in voltage and power requirements and will facilitate miniaturization of micro-total-analysis systems (mTAS) and microfluidically driven actuators.
Figures:
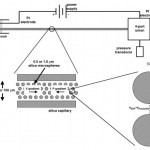
- Fig. 1. EK pump operation and characterization. (a) Schematic of experimental setup. Voltage applied across a capillary packed with silica microspheres leads to flow and pressure generation. The fluidic resistance of the output channel controls the pressure and flow rate. Pressure is measured with a transducer and flow is measured by observation of meniscus motion through the output channel. (b) Expanded view of EK pump. Voltage gradient induces EOF from left to right; pressure gradient induces Pouiseille flow from right to left. (c) Expanded view of pores in between microspheres. Flow pattern is a linear superposition of solenoidal EOF from left to right and pressure-driven Poiseuille flow from right to left. doi pdf
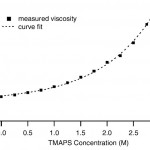
- Fig. 2. Solution viscosity as a function of TMAPS concentration. An exponential curve fit is used to phenomenologically fit the data. doi pdf
- Fig. 3. Effect of TMAPS on maximum pressure per volt (Pmax/V), measured at zero net mass flux. For this figure and Figs. 4-6, the buffer is 10 mM Tris with varying TMAPS concentrations, and results for each pump are normalized to the value obtained for that pump without TMAPS. The dashed line is a prediction based on water’s dielectric constant of 81 and a linear dielectric increment of 52/M. Error bars indicate the standard deviation of the linear fit of the pressure vs. voltage curve at each concentration. doi pdf
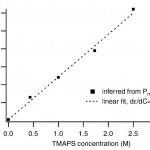
- Fig. 4. Dielectric increment of TMAPS inferred from a linear fit of Pmax data in over a concentration range of 0-2.5 M. doi pdf
- Fig. 5. Effect of TMAPS on Qmax/V, measured at zero pressure. Dashed line indicates predicted Qmax/V using experimental viscosity data and a dielectric increment of 52/M. Error bars indicate the standard deviation of the linear fit of the flow rate vs. voltage curve at each concentration. doi pdf
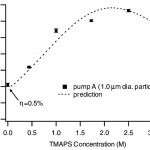
- Fig. 6. Efficiency as a function of TMAPS concentration. Dashed line is a prediction Eq. (5) using experimental viscosity and conductivity data and a dielectric increment of 52/M. Error bars indicate the standard deviation of the measured efficiencies at various voltages for each concentration. doi pdf
