Applied Optics, 1998: Measurements and modeling of acetone laser-induced fluorescence with implications for temperature-imaging diagnostics
Citation:
Thurber MC, Grisch F, Kirby BJ, Votsmeier M, Hanson RK
Measurements and modeling of acetone laser-induced fluorescence with implications for temperature-imaging diagnostics, Applied Optics 37:4963-4978 (1998). doi pdf
Abstract:
Recent determinations of the temperature dependence of acetone fluorescence have permitted the application of acetone planar laser-induced fluorescence imaging, which was already popular for mapping concentration, to the measurement of temperature. With a view toward developing temperature imaging diagnostics, we present atmospheric-pressure fluorescence and absorption results acquired with
excitation at eight wavelengths across the absorption feature of acetone and at temperatures from 300 to 1000 K. Modeling of the fluorescence yield of acetone is shown to be useful in explaining both these results and the variation of acetone fluorescence with pressure and composition that was observed in several studies. The model results in conjunction with the photophysics data provide guidance for the application of temperature diagnostics over a range of conditions while also suggesting useful multiparameter imaging approaches.
Figures:
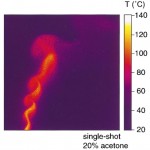
- Fig. 1. Acetone PLIF temperature image obtained with 266-nm excitation and a flow field uniformly composed of 20% acetone in air. Instabilities are evident in this heated jet in weak crossflow. The imaged region is 22 mm on a side. doi pdf
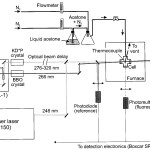
- Fig. 2. Experimental schematic for acetone fluorescence and absorption temperature-dependence experiments. An acetone–nitrogen mixture is passed through a heated, optically accessible flow cell. Laser excitation is provided by a KrF excimer laser (248 nm), a frequency-quadrupled Nd:YAG laser (266 nm), and a Nd:YAG-pumped dye laser (276–320 nm). doi pdf
- Fig. 3. Fluorescence per molecule per unit laser fluence at atmospheric pressure, normalized to the room-temperature value for each wavelength and plotted as a function of temperature for all eight excitation wavelengths. For this figure and subsequent figures in this section, symbols represent experimental data points and lines are fits to the data. doi pdf
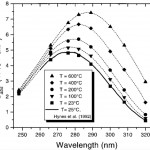
- Fig. 4. The absorption spectral profile of acetone is seen both to shift to longer wavelengths and to increase in magnitude as temperature is increased. Room-temperature data from this study match the results of Hynes et al. doi pdf
- Fig. 5. The normalized absorption cross section of acetone shows a steady rise with temperature, with the effect increasing with wavelength. Eight excitation wavelengths are plotted. doi pdf
- Fig. 6. Relative temperature dependence of the fluorescence yield, obtained by division of the normalized fluorescence signal by the normalized absorption cross section at each temperature. doi pdf
- Fig. 7. Fluorescence per unit laser energy per unit mole fraction at atmospheric pressure, normalized to the room-temperature value. At constant pressure and seeding fraction, temperature can be inferred from a fluorescence measurement with this plot. For clarity, only five excitation wavelengths are considered. doi pdf
- Fig. 8. Fluorescence signal ratios (P =1 atm) produced by five different wavelength combinations, plotted as a function of temperature. Each data point represents the ratio of the longerwavelength fluorescence signal at a given temperature to the shorter-wavelength signal at the same temperature. doi pdf
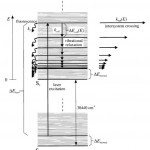
- Fig. 9. Simplified model of acetone’s photophysical behavior with multistep decay of the excited singlet. doi pdf
- Fig. 11. Fluorescence-yield pressure-dependence data of Yuen et al. and Ossler and Alden converted from fluorescence lifetime data under the assumption of a constant fluorescence rate compared with the optimized model results and with slightly off-optimum model results. doi pdf
- Fig. 12. Variation of the fluorescence yield with temperature and excitation wavelength plotted for the optimized model parameters on an absolute basis, with the Heicklen result at 40 deg C and 313 nm as a reference. For each wavelength the temperature-dependent data reported here are compared against the model, with a constant factor (determined by best fit) used to normalize the experimental data, which carry only relative information, at each wavelength. doi pdf
- Fig. 13. Variation of fluorescence yield with temperature examined more closely for 266-nm excitation. The optimized model results and the slightly off-optimum results (dashed and dotted curves) are plotted on an absolute basis. Our relative fluorescence yield data are multiplied by a constant to provide the best fit to the model. Ossler–Alden data are converted to fluorescence yield based on the value of fluorescence rate found by Hansen and Lee. doi pdf
- Fig. 14. Model-generated curves of fluorescence per unit mole fraction per unit laser fluence, plotted for three wavelengths and four different pressures. Each curve is normalized to unity at room temperature. doi pdf
- Fig. 15. Estimated single-wavelength temperature uncertainties for a hypothetical, shot-noise-limited experiment. Families of curves, with pressure varying from 0.5 to 5 atm in 0.5-atm increments, are plotted for 248- and 266-nm excitation. doi pdf
- Fig. 16. Normalized, model-generated fluorescence ratio curves (as in Fig. 8), plotted for two wavelength pairs and four different pressures. doi pdf
- Fig. 17. Dual-wavelength temperature uncertainties plotted for hypothetical, shot-noise-limited experimental conditions, with constant acetone partial pressure. Families of curves, with pressure varying from 0.5 to 5 atm in 0.5-atm increments, are plotted for the 308-248-nm and 308-266-nm wavelength pairs. doi pdf
- Fig. 18. Error in measured temperature with the dualwavelength strategy that is due to a differential change in pressure. Families of curves, with pressure varying from 0.5 to 5 atm in 0.5-atm increments, are plotted for the 308-248-nm and 308- 266-nm wavelength pairs. doi pdf
