Game theoretic prediction of railway passenger demand: a case study of Kobe-Osaka commute
News article that motivated me to write this blog: https://www.cnn.com/travel/article/tokyo-commuter-olympic-intl-scli/index.html
Japan’s railway system is considered one of the most efficient. However, it still does not escape crowding and congestion, with peak hours described as “transport nightmares”. This blog then focuses on how we could predict the number of passengers travelling on rail routes based on game theory and networks.
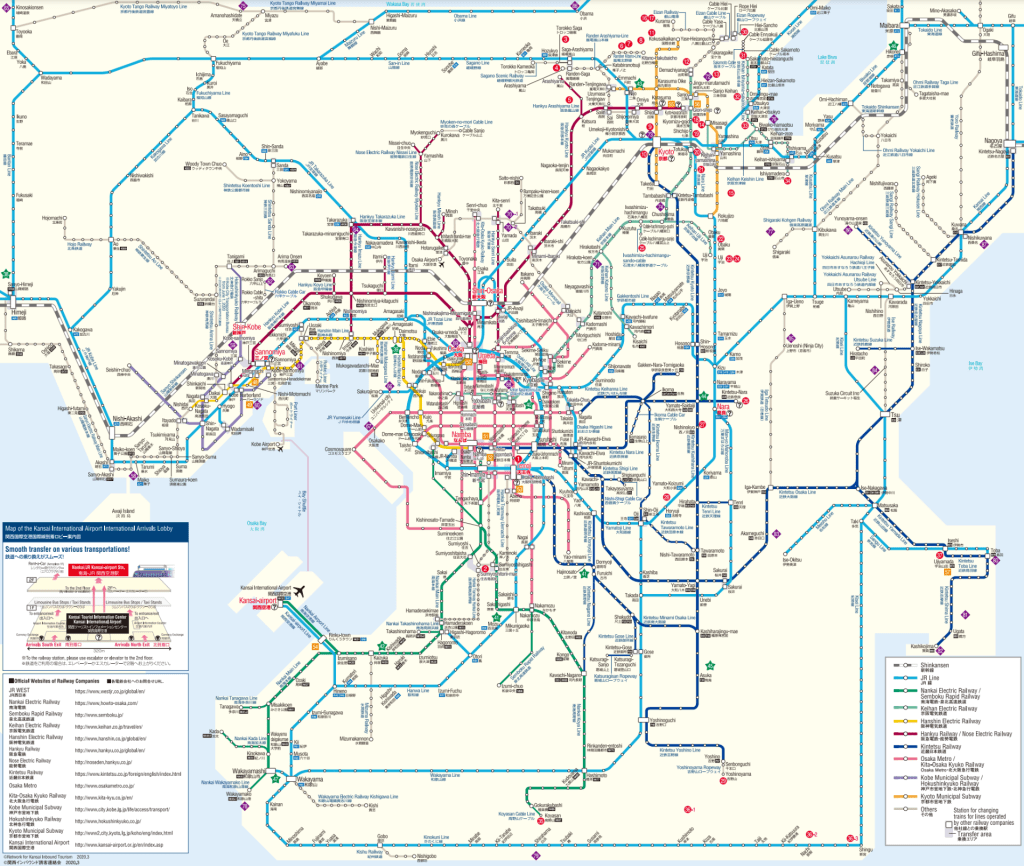
Essentially, transportation systems can be conceptualized as networks. Railway systems are not an exception: with stations as nodes and different routes as edges. The following image shows the map of rail network in Keihanshin Metropolitan Area (From https://osaka-info.jp/).
Introduction
Japan is arguably a country that runs on railways. Railroads account for 72% of the passenger-distance share of all passenger transport (Statistics Bureau of Japan 2021), with a large portion of commuters using trains every day to get to work, especially in the Major metropolitan areas (MMAs) such as Greater Tokyo, Chūkyō, and Keihanshin (Ministry of Land, Infrastructure, Transport and Tourism 2017). The railway system comprises the privatized Japan Railways (JR) Group, metros and many private railway companies (Calimente 2012). The fierce competition between individual railway companies has led to the formation of often seemingly redundant routes that lie parallel to each other, serving the same neighbourhoods.
One such example can be found in the Keihanshin metropolitan area, which comprises Osaka, Kyoto and Kobe. Between two of its three cores, Kobe and Osaka, one could find several parallel routes covering roughly the same neighbourhoods and ending up in many stations with the same names. In this study, an imaginary trip from Osaka Umeda to Kobe Sannomiya (Figure 1) is considered. Between this pair of origin-destination, one could choose the Hanshin Main Line (Green), the Hankyu Kobe Main Line (Orange), or the JR West Kobe Line (Red). In reality, the Shinkansen also serves as a route, but as it is a service focused on long-distance travel, it is omitted from this study.
How, then, would passenger choose between each of these three routes? What can we predict about the number of passengers on each route? This blog provides a methodology to approach this problem using game theory and graph theory concepts, thanks to the INFO 2040 course at Cornell.
Methodology
Network Formulation and Construction of a Game Theoretic Scenario
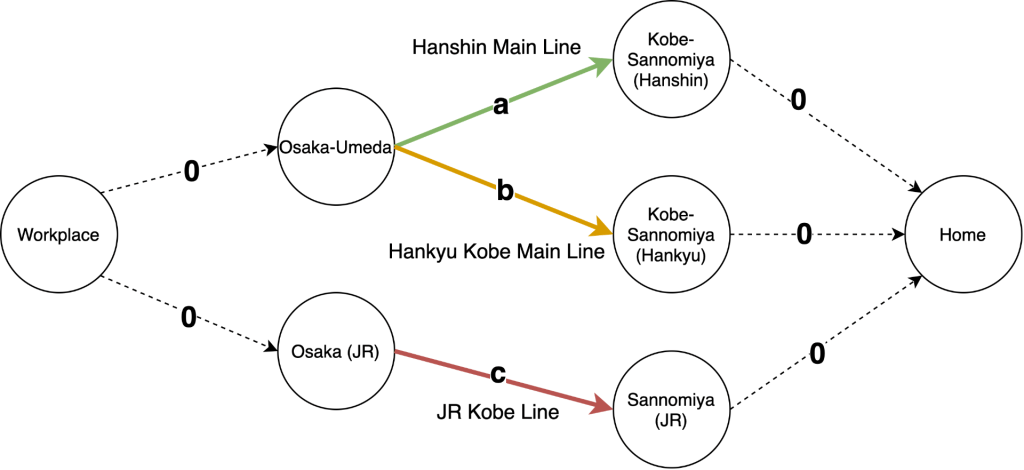
Suppose that a number of travellers are commuting back to thier home near Kobe Sannomiya (The central station of Kobe) from their workplace near Osaka Umeda (The central station of Osaka). To analyse the problem, we construct a network. We conceptualise each station as a node and each railway route as an edge. We conceptualise the distance to or from their home and workplace to the stations as 0 for modelling purposes (This is valid as the different stations are extremely near in physical distance, with the farthest pair only 400 meters apart). Thus the following graph can be formed (Figure 2): with eight edges (Hanshin Main Line, Hankyu Kobe Main Line, the JR Jobe Line and the edges connecting the stations to the workplace or home) and 7 nodes (the 5 stations, home and workplace).
Each of a, b, c represents the travel time on each of the edges of Hanshin, Hankyu and JR.
Based on data from the Ministry of Land, Infrastructure, Transport and Tourism (MILT), we estimate that approximately 60000 commuters travel from Osaka Umeda to Kobe Sannomiya for an hour.
Three factors that affect the route choice of passengers are identified:
- Travel time
- Monetary cost of the ticket
- The level of crowding
Crowding is an interesting variable: it is not a fixed value for a certain route. It varies according to the number of travellers on a certain route. This meant that the travel experience of one passenger depends on not only their own choice but also the choice of other passengers. Thus we are getting a situation that can be conceptualized as a game, with:
- Players: the 60000 commuters traveling from Osaka to Kobe
- Each with a set of strategies to choose from: use the Hanshin, Hankyu or JR line
- With a payoff that depend on the behaviour of other players (which strategy they chose): the percieved travel time which depends on real trave time, monetary cost of ticket and the level of crowding depending on the number of traveles on each route.
As the total number of players is 60000, we can have:
Where ,
, and
is the number of travelers on the Hanshin Main Line, Hankyu Kobe Main Line, and JR Kobe Line between Osaka Umeda (or equivalent) and Kobe Sannomiya (or equivalent) in an hour respectively.
Payoff Formulation
The payoff of choosing a certain route is then the percieved travel time,
. This is a function of real travel time,
, monetary cost of ticket,
and the surplus of percieved travel time due to crowding,
:
For consistency of measurement, will be converted from using monetary vale of Yen, to the equivalent travel time in minutes, expressed as
. This will be done by using the median hourly rate of Kobe, 3082 Yen per hour, as a baseline:
The surplus of percieved travel time will be calculated base on a time surplus multiplyer, , acting on
. This will be calculated based on the load factor,
, which is defined as the percentage of occupancy of the designed standard capacity of trains passing in an hour,
. Thus:
and therefore:
A method need to be found to convert to
. In other words, this is a crowding valuation problem. Here a meta-analysis result based on 208 empirical valuations is adopted (Wardman and Whelan 2011). The following implied multipliers are found:
| Seated multipliers | Standing multipliers | ||||
|---|---|---|---|---|---|
| LF/% | Commute | Leisure | LF/% | Commute | Leisure |
| 50 | 0.86 | 1.04 | 50 | / | / |
| 75 | 0.95 | 1.14 | 75 | / | / |
| 100 | 1.05 | 1.26 | 100 | 1.62 | 1.94 |
| 125 | 116 | 1.39 | 125 | 1.79 | 2.15 |
| 150 | 1.27 | 1.53 | 150 | 1.99 | 2.39 |
| 175 | 1.40 | 1.69 | 175 | 2.20 | 2.64 |
| 200 | 1.55 | 1.86 | 200 | 2.44 | 2.93 |
The commuting standing multipliers are adopted. A linear regression is performed on the data, giving the following conversion relationship:
We can therefore express the payoff as:
It is found that the value for Hanshin Main Line, Hankyu Kobe Main Line, and JR Kobe Line between Osaka Umeda and Kobe Sannomiya to be 17364, 26574, and 15364 respectively.
Real travel time, , is found to be 38, 32 and 22 minutes for Hanshin Main Line, Hankyu Kobe Main Line, and JR Kobe Line respectively. This is found by using the travel time between Osaka Umeda and Kobe Sannomiya on the fastest train(s) in peak hours. For JR Kobe line this is the Special Rapid Service (for HIMEJI), for Hanshin the Rapid Express Service (for Kobe Sannomiya), and for Hankyu the Commuter Limited Express Service (for Kosoku Kobe).
The price tickets, , is found to be 320 Yen on Hanshin and Hankyu, and 410 Yen for JR. These information are extracted from the corresponding timetable search engine on each of the operator’s websites (Hankyu Corporation 2022; Hanshin Electric Railway 2022; JR-West 2022).
Thus the payoff formula for Hanshin Main line could be expressed as:
Same for Hankyu Kobe Mainline:
and for JR Kobe Line:
Finding Nash Equilibrium
At Nash equilibrium, all strategies (routes) should have the same payoff (percieved travel time). Only in that case we would expect no incentive for commuters to switch routes, and thus it would be a mutual best response for everyone (Easley and Kleinberg 2010). Thus:
Therefore, the following system of equations could be formed:
Results
By solving the system of equations, we obtain:
Thus we predict that 10623 would travel on the Hanshin Main Line, 25344 would travel on Kankyu Kobe Main Line, and 24033 would travel on the JR Kobe line in one hour between Osaka Umeda and Kobe Sannomiya (if total traveler is 60000).
The percieved travel time at equilibrium would then be 55 minutes.


