Information Cascades and Diffusion Models In Response to a Crisis
Information cascades in social media in response to a crisis: A preliminary model and a case study:
https://www.researchgate.net/publication/239761833_Information_cascades_in_social_media_in_response_to_a_crisis_A_preliminary_model_and_a_case_study
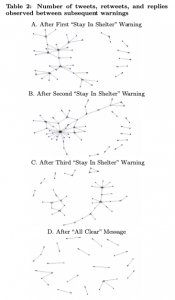
The link provided is a study regarding the social media response to a crisis at RPI. On April 6th, 2010, there was an armed robbery near the campus. The armed robber was then seen walking around campus soon after the robbery. Soon after this was seen, the campus went into lockdown. There were 3 different waring messages and an all-clear message sent to the student body. This study measured the twitter activity regarding the incident, both during and after. This study found that the most twitter activity was seen between the second and third warning messages sent out.
My theory is that people find this sort of information the most intriguing after the second warning message. Maybe the threat feels the most credible and real at this point. The first warning may be more of a shock to people, while the second puts real fear into people’s minds. Finally, by the third warning message people are already fully aware of what is going on so people may not feel as scared (Again, not a part of the study but my theory).
This study relates to the topics covered in class because it maps the twitter activity through the use of a diffusion model with nodes and edges. In the graphs shown, an edge is made when a user retweeted a message from another user. For example, in the second diffusion model (“After Second ‘Stay in Shelter’ Warning”), many users retweeted from the same source. It is not stated in the article, but I am going to assume that this source was likely the school telling people to shelter in place. I am making this assumption because the amount of retweets that it got suggests it is the most credible source. In the fourth diffusion model (After ‘All Clear’ Messages), there were retweets from many different sources. Not much appeared to originate from a single source. My theory is that many of these retweets were from things that other students said rather than from the school. 
A diffusion model has a basic underlying premise: how do individuals make decisions based on the decisions of their neighbors? In this model, people made the decisions to retweet information based on the information that they saw on twitter. If they saw a lot of people retweeting a source and thought the source was credible, there is a good chance they decided to also retweet the information. I believe that the decision to retweet a post is like the decision for a person to say whether the bag is Majority Red (MR) or Majority Blue (MB). In this experiment, if a person saw two people say that the bag is MB, every person down the line will also say that the bag is MB. Every person repeats this same color because they trust that the information being stated before them is true. Similar to a decision to retweet information, the user that is retweeting also believes that the information before them is true. Take the second graph for example. We see and extensive network of retweets because many people in the model believe that the information is true and relevant. Once a few people retweeted the same tweet, we see an extensive network of that tweet.
However, it is important to note that this experiment does not directly correlate to a decision to retweet a message. A better experiment that would directly correlate may be to take a bunch of people, give them multiple sources of information regarding a crisis, and tell them that they must retweet one of the sources that they believe is true. In this experiment, I believe that we would see many people retweeting the same source over time. Once a few people retweet one of the sources, many people will likely begin to trust their neighbors and retweet this source.
