Intro to information cascades with uneven signal reliabilities
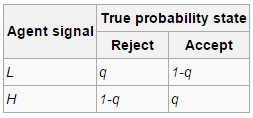
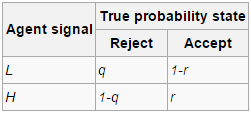
When we were working with information cascades in class, we operated under two very large assumptions about the environment of the experiment–there is a 50-50 chance that the experiment is in a predetermined “good” or “bad” state. In addition, we assumed that a “bad” state has the same probability of showing a low signal as a “good” state has of showing a high. In the context of the balls-in-an-urn analogy, this is like saying a red-major urn will have the same percent of red balls as a blue-major urn will have blue balls. What if instead we had non-symmetric states? For example, a red-major urn might have 70% red balls, and a blue-major urn might have 80% blue balls. How many initial rejects would lead to a cascade? We’d have a table describing the game that looks more like:
Now, a cascade of rejects and a cascade of accepts might form under different circumstances. Let’s consider the case where there is a rejection cascade, where S_H is the event where the current person receives a high signal and everyone prior is reliable, and S_L a low signal, with everyone prior being reliable, G for when the actual state is good, B for when it’s bad. For a person to reliably guess a state based on his signal, we want Pr[G|S_H], Pr[L|S_L] >= 0.5. To determine how many people is required to start this cascade, we want to calculate who the last reliable person is:
From these calculations, we can not only get the number of reliable students(by calculating the smallest n such that the inequality on the left is violated), we also get a sense about the bounds of the experiment itself, namely, q must be >=0.5
There are still many other calculations that can be done with this, e.g., what kind of difference(or perhaps it’s a ratio) of rejects/accepts would prevent a cascade from happening, in other words, what is the “threshold” for this cascade to begin at any point, rather than just given a beginning sequence of a single vote? We can still generalize this problem one step further with a different probability of the experiment being in a “good” and “bad” state, but I’ll leave it as an exercise for the reader.
Source:
Wikipedia(http://en.wikipedia.org/wiki/Information_cascade) for the image, but otherwise from a mental itch I had to try to scratch after doing homework 6.


