

Andrew Landers1, Tomas Palleja Cabre 2, Jordi Llorens 3
1 Cornell University, Geneva, NY 14456, USA. andrew.landers@cornell.edu
2 Department of Computer Science and Industrial Engineering, University of Lleida, Jaume II, 69, 25001 Lleida, Spain
3 Department of Agricultural and Forest Engineering, Research Group in AgroICT and Precision Agriculture, University of Lleida – Agrotecnio Center, Rovira Roure, 191, 25198 Lleida, Spain
The application of pesticides has been of concern for many years, particularly methods of reducing drift and improving deposition. There are many interrelated factors which affect spray application depending upon the target, the efficacy of the spray, the attitude of the operator, the standard of management, the weather etc.
In modern vineyards there are numerous row widths, varieties, plant spacing and variations in canopy shape and style. Canopy characteristics (height, width and density) also change as the growing season progresses.
Good disease and insect control is dependent upon the correct amount of pesticide being applied at the correct time. Incorrect application may result in pest resistance, poor pest or disease control, increase costs for the grower, and an increased risk of chemical contamination in the environment. Adjusting airflow and liquid flow to match the growing canopy as the season progresses is the key.
Landers (2016) describes real-time adjustment of the operating parameters (air flow, pressure, active nozzles, etc.) according to the target density as an important goal for canopy spraying systems. Keeping the spray cloud within the canopy is the goal resulting in reduced spray drift and increased deposition.
Fruit sprayers comprise two systems. The first system is the liquid spray and the second and, equally important for vine crop applications, is the airflow. The liquid flow is based upon nozzles and pressure, the airflow is based upon a fan to provide air for canopy penetration.
Liquid flow and canopy structure
There are two main aspects to consider when applying liquids, the volume of product and the volume of water. Many growers typically apply X L/ha pre-bloom and then Y L/ha post-bloom with the intention of getting good leaf coverage. Unfortunately poor spray coverage is a major factor contributing to poor insect and disease control. Better coverage leads to better control and a thorough application of an effective material is required. Uneven coverage increases the amount of pesticides that must be applied in order to provide adequate control on poorly covered areas and can increase the number of sprays required if it allows insects or a disease to become established. Applying the correct amount of spray at the correct time to the correct target is good advice. Canopy size and shape will affect application volume and there are as many dangers in not applying enough spray as there are in applying too much.
Automation
Llorens et al (2013) and Llorens and Landers (2014) developed a method of liquid control, adapting the Lechler Vario-Select (Lechler GmbH,Metzingen,Germany) nozzle system from horizontal boom sprayers and applying it to the vertical boom found on tower fruit sprayers. The Lechler Vario-Select comprises a cluster of nozzles, each nozzle being operated individually or in a combination thereof, allowing a wide range of outputs to be obtained. The Lechler system used compressed air to open and close the nozzles. This method allows the use of variable rate technology (VRT), a basic requirement in the precision farming concept.
Previous research, at Cornell University, lead to the development of an adjustable louvre to control the air leaving the sprayer, discussed earlier. When drift is reduced by adjusted air volume or speed, deposition within the canopy or on the fruit increases. Currently the sprayer operator manually adjusts the louvre via an adjustable stroke length actuator that moves the louvre, thus matching airflow to canopy size. Unfortunately in heavy canopies it is a challenge to see how far the spray cloud is passing through the canopy.
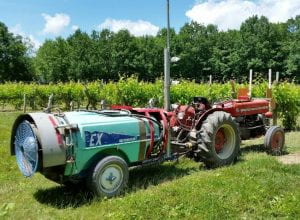
Llorens et al (2013) developed a system which measured the distance from the ultrasonic sensor to the edge of the vine canopy. The low-cost system calculated canopy volume based upon the distance and time of the ultrasonic system and the centerline (trellis posts) of the canopy. The assumption being made that the rows of vines were in a straight-line and the tractor was being driven in a straight-line, neither being commonly found. The ultrasonic system detailed in previous work (Palleja & Landers, 2015) was used in the field trials. The canopy sprayer was a Berthoud S600 axial fan sprayer. It incorporates a set of 4 ultrasonic sensors (XL-MaxSonar MB7092) mounted on a 3 m long mast (Figure 1). The sensors are distributed along the mast according to the height of the vines. A microcontroller board was used to estimate the canopy density as a function of the ultrasonic echoes. It was tested as the growing season progressed and the data obtained was highly correlated with the season but it was not compared to actual canopy density. The sensor system was further modified to monitor canopy density and volume resulting in the ability to adjust the airflow actuator and the liquid flow from the nozzles based upon canopy density.
Point Quadrat Analysis (PQA) was used to compare the ultrasonic data with a scientifically accepted method to estimate canopy density, check if the data is correlated, and validate the ultrasonic system. Point Quadrat Analysis (PQA) is an acceptable yet simple field method to measure key parameters of the canopy characteristics. In PQA, a probe is passed through the canopy and any contact with biomass such as leaves or fruit are identified and recorded (Smart, 1985; Smart & Robinson, 1991). The canopy is sampled at specific heights, which is usually at the fruit zone, at consistent intervals along the row. Enhanced Point Quadrat Analysis (EPQA) was a further development of the PQA method by Meyers & Vanden Heuvel, (2008) and is a more descriptive system as it adds metrics which allow cluster exposure mapping and leaf exposure mapping to measure sunlight distribution.
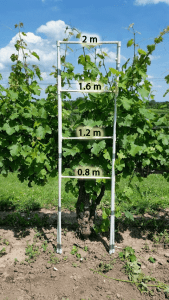
Two plastic frames were built to perform PQA in the two vineyards (0.5×2 m, Figure 2). The frames have 4 horizontal bars, matching the ultrasonic sensors’ height. Each horizontal bar has 6 marks spaced 10 cm apart, indicating the position where the operator introduces the probe to count the number of leaf layers.
The experiments were conducted in fields belonging to Cornell University during the growing seasons of 2015 and 2016. Vineyards of V. vinifera cv. Vignoles and cv. Cabernet Franc grapevines were used. The field trial consists of using the ultrasonic system to scan both sides of a row at 4.6 km/h as well as perform PQA. The PQA frame has 24 different positions and it is moved along the row at 4 random locations, making a total 96 samples per row per week. The average 96 PQA samples, named |PQA|, is compared with the average of the 4 sensors’ wc (the average of the full sum of ultrasonic sound returns, Pallejà & Landers, 2016) along the row, named |wc|. wc values are expressed in volts.
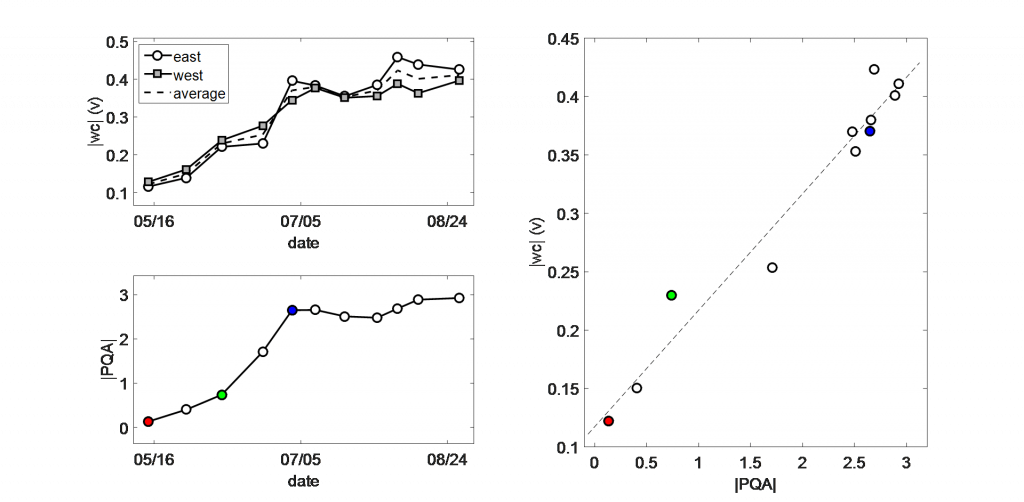
The ultrasonic system shows strong correlation to the acceptable, traditional method of Point Quadrat Analysis (PQA). This work shows that the ultrasonic canopy density method needs to be calibrated for each variety and plant type, in order to be used as a reference for adjustment of the sprayer’s parameters in real time, with the aim of improving deposition and reducing drift.
The ultrasonic system allows the rapid determination of canopy density, providing information to allow the variable application of pesticides in real-time. The ultrasonic system will also provide horticultural researchers with a fast method of comparing canopy density and growth stage for their field trials.
Acknowledgments
Funding for this project was provided by NY Apple Research and Development Program, The Canandaigua Wine Company Endowment, Kaplan Endowment, Lacroute Endowment, and Saltonstall Endowment.
References
Landers A J. (2016). Effective Vineyard Spraying 2nd ed. 2016. Keuka Park, Effective Spraying.
Llorens, J., Landers, A. and Larzelere, W. (2013). Digital measurement and actuators for improving spray applications in tree and vine crops. Proc. 9th European Conference on Precision Agriculture. July 7-11 2013. Lleida, Catalonia, Spain
Llorens , J and Landers A.J. (2014) Variable rate spraying: digital canopy measurement for air and liquid electronic control. In: Aspects of Applied Biology 114. International advances in pesticide application. Pp 1-8
Meyers J M, Vanden Heuvel J E. (2008). Enhancing the Precision and Spatial Acuity of Point Quadrat Analyses via Calibrated Exposure Mapping. American Journal of Enology and Viticulture 59:425- 431
Palleja T. and Landers A J. (2015). Real Time Canopy Density Estimation Using Ultrasonic Envelope Signals in the Orchard and Vineyard. Computers and Electronics in Agriculture, pp. 108-117.
Palleja, T. and Landers, A.J. (2016). Orchard and vineyard real time spraying adjustments using ultrasonic echoes. In: Aspects of Applied Biology 132. International advances in pesticide application. Pp 405-410.
Smart R E, Robinson M. (1991). Sunlight into Wine: A Handbook for Winegrape Canopy Management. Winetitles, Adelaide.
Smart R E. (1985). Principles of grapevine canopy microclimate manipulation with implications for yield and quality. A review. American Journal of Enology and Viticulture 36:230-239