All posts by douglashfisher

Director of Outreach, Education, Diversity, and Synthesis (OEDS) of CompSustNet

A Recap of CompSust DC 2019

This is a guest post by Lily Xu, a Ph.D. student at Harvard University, and co-chair of the 2019 Computational Sustainability Doctoral Consortium at Carnegie Mellon University (CompSust DC 2019). Lily can be reached at lily_xu@g.harvard.edu.

In October, a lively group of graduate students and junior researchers met up in Pittsburgh for the fourth annual Computational Sustainability Doctoral Consortium. Hosted at Carnegie Mellon University, the consortium aims to bring students together to promote discussion and promote collaboration. This event offers a concentrated opportunity for students to learn about relevant computational techniques and their novel applications to sustainability challenges.

CompSust DC participants at Carnegie Mellon.

This year’s DC was the largest yet — we had 55 participants from a diverse range of institutions, including from Canada, Colombia, and Spain. Whereas previous years were attended mostly by computer science PhD students, this year’s participants included assistant professors, researchers in industry, and students studying public policy, geography, environmental engineering, veterinary medicine, and food science.

Prof. Doug Fisher delivering a keynote talk on mechanisms for broader impacts in computational sustainability.

The events included three talks from CompSust affiliated-faculty (Fei Fang, Zico Kolter, and Doug Fisher), four student tutorials, numerous student presentations and posters, and a lively “collaborathon”! The student presentations covered a broad range of topics, spanning ecology, food waste, agriculture, energy, climate adaptation, and transportation. A full list of student speakers and presentation titles are available here.

Participants chatting about their work during a poster session.

Participants were incredibly engaged throughout the entire two-and-a-half days, including at group dinners and Sunday field trip. Personally, I feel fortunate to have played a role in this community-building event, and am very grateful that this community exists in the first place! There is a lot of excitement to continue making the DC an annual event even after the NSF Expeditions in Computing award for CompSustNet ends in 2020. We were thrilled to already hear of interest among some participants in organizing the event next year.

Attendees sitting down to dinner at The Yard.
Our group enjoying the botanical gardens at Phipps Conservatory for the field trip on Sunday.

One of the responses we received in the feedback survey offered a reflection that made the entire effort of organizing the DC worthwhile: “It was a fantastic experience and will continue to be highly recommended. I learned a great deal and with the network feel more confidence about my work.” We are grateful to everyone who made the weekend so worthwhile by participating in the DC, whether as a keynote speaker, tutorial host, student presenter, or attendee.

CompSust DC 2019 was co-organized by Priya Donti (CMU), Lily Xu (Harvard), Genevieve Flaspohler (MIT), Aaron Ferber (USC), and Sebastian Ament (Cornell), with faculty support from Carla Gomes (Cornell), Zico Kolter (CMU), and Fei Fang (CMU). The organizers would like to thank Ann Stetser (CMU) and Nancy McCarthy (CMU) for extensive administrative support. They would also like to thank this event’s co-sponsors, the National Science Foundation, Carnegie Mellon University, and Cornell University.

An Update on Region Radio — Using AI to Disseminate Information on Environmental and Cultural Conservation through Story Telling

This is a guest post by Cassidy McDonnell. See Cassidy’s bio and the bottom of this post.

Have you ever driven by an interesting building or an intriguing trailhead? You might glance up from the road, think “hmm, I wonder what that could be”, ponder for a moment or two, and then sleepily continue on your drive. You make a mental note to look up the landmark later when all of a sudden, a small voice from the backseat squeals about a “bathroom emergency” and before you know it, you’re scrambling towards the closest rest stop praying that you make it there before it’s too late.

Your mental note about the landmark flies out the window with the miles that pass and by the time you’re breathing a sigh of relief and patting yourself on the back for yet another averted crisis, all previous thoughts about that intriguing sculpture you passed pre-”bathroom emergency” have vanished. By the time you pack everyone into the car and get back on the road, all you can hear is the static on the radio and the GPS announcing that you need to turn right in 227 miles.

What if, instead of enduring those annoying advertisements and songs you’ve heard a thousand times before, you could learn all about these mysterious places right on the spot? That’s where Region Radio comes in. Although resembling a podcast (or any other storytelling device) in form and function, Region Radio has quite a lot going on behind the scenes. This program is a place-specific learning tool that facilitates interactions between users and the environments in which they find themselves. Focused on environmental and historical preservation, Region Radio aims to share the untold and under-told stories of places that are often glazed over or entirely forgotten in mainstream narrative settings. This is consistent with Vanderbilt’s outreach role within CompSustNet.

How does it work?

Region Radio creates a playlist for each trip using a recursive backtracking algorithm. It first looks at the entire trip and focuses in on the final destination. It then searches the web for an interesting story about that ending point. Once it finds a story that is interesting to the user (we’ll call it “Story 1”), it adds that story to its playlist and reanalyzes the trip from the starting point and ending at the opening of Story 1. 

Figure 1: Example Playlist Construction: The playlist is built backwards starting by finding an interesting story about point B. The time it takes to tell Story 1 determines the location of point B1, which determines the subject of Story 2. Each story is determined and built from the stories that follow it in the playlist.

Figures 1 and 2 display a visual example of how the program works. For the 30-minute trip shown, the program searches the radius around point B (depicted in Figure 2) . In this example, a six-minute story is found, added to the very end of the playlist, and labeled “Story 1”. Region Radio then treats point B1 as the end of the trip and searches for an interesting story within its designated radius. Within this radius, the program finds Story 2, and Story 2 is added to the queue immediately before Story 1, playing as the vehicle approaches point B1. This strategy is repeated for the entire trip, eventually compiling a full playlist from point A to point B.

See the caption
Figure 2: Example radii: for each point, Region Radio searches within a given radius to find a landmark with an interesting story. Radii distances can be adjusted based on story density and interestingness for each location.

Region Radio is also programed to adjust the size of the search radius depending on the density of interesting stories found in a given area. So, for example, if the program doesn’t find any interesting stories in the initial search radius, it will expand the radius until it comes back with a story that RR believes the user will want to hear. If many stories are collected within the initial radius, the story delivered to the user is determined by length (longer stories are prioritized), user preferences and interests, and whether or not a user has heard a particular story before.

Our team is currently working on improving the user’s experience by developing parameters for determining story interestingness and place relevance as well as improving the program’s audio aesthetics. Currently, we are using a Google text-to-speech API to translate written stories to audio files. Although this API uses more inflection, emotion, and vocal variation than the Amazon Polly API (which the program was using previously), the Google version is still rather robotic in nature, which can make stories sound less interesting. In order to combat this hurdle, our group is currently working to include existing podcasts in the story playlists and recruit student narrators to read stories aloud for the program. We expect that these developments will improve user experiences by making stories more engaging.

Additionally, we are currently developing parameters to determine “interestingness” and “place relevance” of suggested stories as well as create connections between those stories. These parameters will eventually be implemented into the program in order to create playlists that are even more relevant and captivating.

Check out earlier posts on the CompSustNet blog on Region Radio and Related Works and on Heightening Environmental Responsibility through Place Attachment, as well as a recent paper presented at the International Conference on Computational Creativity (p. 336 of the proceedings) entitled Region Radio: An AI that Finds and Tells Stories about Places by Douglas H. Fisher, and last year’s undergraduate research assistants: Emily Markert, Abigail Roberts and Kamala Varma .

Region Radio began as a collaboration between the CompSustNet  lab at Vanderbilt University and the Space, Learning, and Mobility lab at Vanderbilt University.  Research and development of Region Radio has been supported by NSF Award #1521672 “Collaborative Research: CompSustNet: Expanding the Horizons of Computational Sustainability” and NSF Award #1623690 “EXP: Bridging Learning in Urban Extended Spaces (BLUES) 2.0

Cassidy McDonnell is a May 2019 graduate of Vanderbilt University in Civil Engineering. She became interested in Computational Sustainability through Vanderbilt’s University Course on the Ethics of Artificial Intelligence, which included a module on Computational Sustainability. Cassidy can be reached at cassidy.a.mcdonnell@vanderbilt.edu. The opinions expressed herein are Cassidy’s and do not necessarily represent the opinions of Cornell University.

SURTRAC: an adaptive traffic control system

This is a guest post by Cassidy McDonnell. Cassidy’s bio follows the post.

In the early 1960s, The Jetsons exposed us to a future filled with elaborate innovation: robots, holograms, and, maybe most notably, flying cars. Since those days, we as a society have eagerly awaited an idyllic world filled with these whimsical vessels void of traffic, congestion, and road rage.  And yet, here we are, almost 60 years into the Jetsons’ mystical future and instead of

Source: giphy.gif

we have

Source: Innovationorigins.com

And although we in the U.S. like to complain about our lengthy commutes, especially in cities like Boston, D.C. and L.A., the congestion in these cities truly cannot compare to some of our global neighbors on the opposite side of the Pacific (https://www.bbc.com/news/world-asia-pacific-11062708). 

As of 2015, there were 1.3 billion motor vehicles on the road, a number that is expected to grow to over 2 billion by 2040 (http://www.bbc.com/future/story/20181212-can-artificial-intelligence-end-traffic-jams) as technology and economies continue to advance all over the world. Not only is traffic inconvenient, inefficient, and uncomfortable (like in Bengaluru, India (https://qz.com/india/1334967/braving-the-legendary-bengaluru-traffic-jam/) where the average vehicle speed can max out at a swift 2.5 mph during rush hour), but it can also be dangerous for drivers and unhealthy for the atmosphere. (Check out the nine-day traffic jam that stretched across China in 2010 (https://www.bbc.com/news/world-asia-pacific-11062708).

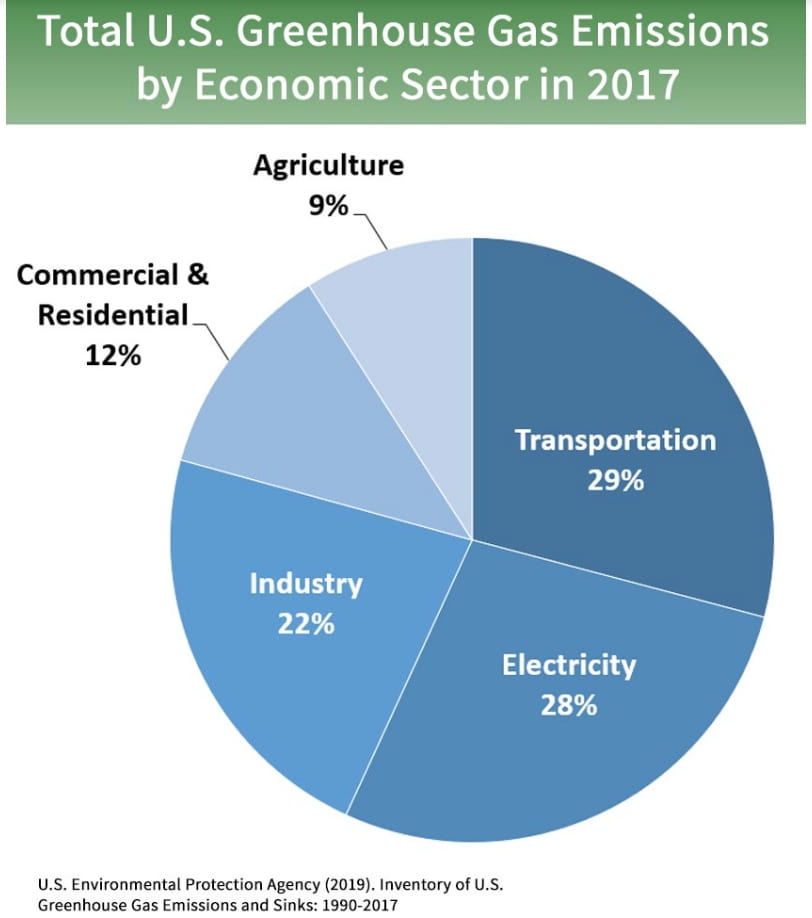
As evidenced by the graph below, transportation is the industry that contributes the greatest amount of greenhouse gas (GHG) and a significant portion of those emissions come from cars stuck in traffic. According to the 2012 Urban Mobility Report from the Texas A&M Transportation Institute (https://cms.dot.gov/utc/2012-urban-mobility-report-released-new-congestion-measures), 56 billion pounds of CO2 were emitted into the atmosphere as a result of traffic congestion. 

To battle these significant CO2 rates, researchers at Carnegie Mellon University have designed Scalable Urban TRAffic Control (SURTRAC), an adaptive traffic control system that optimizes efficiency at intersections in order to minimize congestion and idling. This technology uses videos feeds at intersections to detect the number of vehicles, cyclists, and pedestrians that need to cross in each direction. It then uses these data to adjust green times to the different intersection phases based on the presence, count, and flow rate of the vehicles going in each direction.

SURTRAC differs from other traffic control systems in that is takes a decentralized method to traffic flow: vehicle movement phases are developed and adjusted independently for each intersection. Although each intersection operates on its own, there is significant communication between intersections within the SURTRAC network. For example, if there is significant traffic going in a certain direction at one intersection, that information will be sent to the next intersection down the road. This second intersection can then adjust its phase cycle to account for the incoming vehicle influx and begin mitigating the problem before it even arrives.

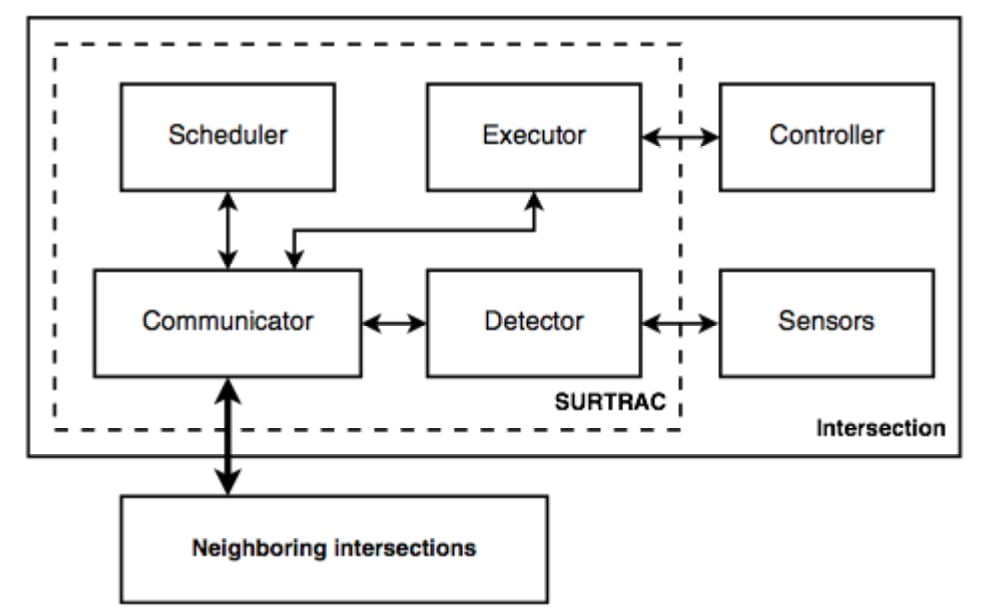
SURTRAC system design. The Detector interfaces with sensors located at the intersection, the Scheduler allocates green time based on incoming vehicle flows, the Executor interfaces with the controller to implement schedules generated by the Scheduler, and the Communicator routes messages locally and to/from neighboring intersections.
SURTRAC system design. The Detector interfaces with sensors located at the intersection, the Scheduler allocates green time based on incoming vehicle flows, the Executor interfaces with the controller to implement schedules generated by the Scheduler, and the Communicator routes messages locally and to/from neighboring intersections. Source https://www.cmu.edu/epp/people/faculty/course-reports/SURTRAC%20Final%20Report.pdf


Implementation of SURTRAC has been highly successful: a pilot study at a network of nine intersections in Pittsburgh’s East Liberty neighborhood (not too far from CMU’s campus) found that the optimizations SURTRAC provides would result in over 155,000 gallons in emissions reductions compared to previous intersection operations procedures  (https://www.cmu.edu/epp/people/faculty/course-reports/SURTRAC%20Final%20Report.pdf). 

In this pilot study, researchers found that wait times at intersections were reduced by 40%, journey times were reduced by 25%, and emissions were reduced by 20%  (http://www.bbc.com/future/story/20181212-can-artificial-intelligence-end-traffic-jams). And with drivers in urban areas spending an estimated 40% of their drive time idling (https://www.rapidflowtech.com/blog/pittsburghs-ai-traffic-signals-will-make-driving-less-boring), this technology could be revolutionary at multiple scales. In addition, the program is designed to optimize all kinds of traffic, including cyclists and pedestrians, which could help promote a shift towards greener forms of transportation.

SURTRAC is spreading contagiously across the city and, as a result, researchers have created Rapid Flow Technologies LLC (https://www.rapidflowtech.com), a spin-off company, in order to promote intelligent transportation systems in the commercial marketplace. As a result, SURTRAC has expanded to 47 intersections in the past three years and Rapid Flow has begun work on other projects like PHAENON (https://www.rapidflowtech.com/phaenon-urban-analytics) to continue to improve urban sustainability through technology and analytics. So for anyone who is sick of traffic and looking to optimize their morning commute, East Liberty may be the neighborhood for you!

Cassidy McDonnell is a May 2019 graduate of Vanderbilt University in Civil Engineering. She became interested in Computational Sustainability through Vanderbilt’s University Course on the Ethics of Artificial Intelligence, which included a module on Computational Sustainability. Cassidy can be reached at cassidy.a.mcdonnell@vanderbilt.edu. The opinions expressed herein are Cassidy’s and do not necessarily represent the opinions of Cornell University.

iWare-E: An Update on the Adversarial Fight Against Poaching

This is a guest post by Cassidy McDonnell. See Cassidy’s bio below.

Unfortunately, the global poaching crisis described in Zimei Bian’s post has yet to be conquered and wildlife crimes are still prevalent in countries such as Uganda, Tanzania, Kenya, Zimbabwe, and South Africa. Species such as the oryx as while as black and white rhinos have already been poached to extinction. Not only do wild animals play a vital role in local ecosystems, but protected areas attract a significant number of tourists, who are important contributors to local economies, workforces, and GDPs. According to a report released by the International Institute for Environment and Development (IIED), on Wildlife Crime in Uganda, major poaching incidents have been recorded in 17 of the 23 protected areas in Uganda.

Park ranger resources are quite constrained in these protected areas, making it difficult to stop poachers from partaking in illegal activities in these places. Zimei’s post described the innovative modeling techniques developed by CompSustNet Associate Director Milind Tambe at the University of Southern California to optimize scheduling for these rangers and maximize the amount of protected area covered by safety officials.

Although PAWS and other programs like it have done important work to increase wildlife protection in Queen Elizabeth National Park in Uganda, Dr. Tambe along with Dr. Shahrzad Gholami and a team of collaborators have continued to address many of its issues with a new innovation: imperfect-observation aWare Ensemble (iWare-E).

iWare-E addresses and improves many of the inconsistencies and problems earlier models had not taken into consideration. For example, PAWS relies on a specific type of explicit attacker behavior for its model. Although this model can handle complex data sets, it is unable to do so on a large enough scale to be effective in national park settings. No program has yet been able to scale up to real world scenarios and each iteration of progress has been limited to scheduling for a single protected area.

Although larger-scale modeling has been attempted, these methods either result in solutions that are of low quality or require significant amounts of time and computing power to run, which are impractical for low resource outposts where these technologies would most need to be implemented. Finally, PAWS and other state-of-the-art models record data on an annual basis, which fails to account for short term poaching patterns.

In contrast, iWare-E evaluates poaching activity seasonally with a timestep (an interval for measurement) that lasts for three months as opposed to a year like in previous models. This model is also less computationally expensive because it includes a scalable planning algorithm that applies a piecewise linear approximation, a change that has resulted in a 150% improvement in solution quality and a 90% improvement in both accuracy and run time.

To use iWare-E, the protected area is broken into a grid of squares that each have an area of one km2. Each square has distinct values describing its terrain, distance values, animal density, and patrol effort (measured by the amount of distance traveled by park rangers across a cell during a specific timestep). An initial training dataset is input into a training algorithm in order to build a matrix to model the collected data, taking into account that not all signs of illegal activity (i.e. snares and traps) will be discovered by the park rangers due to the limited personpower and the hidden nature of many of the traps. This algorithm outputs classifiers and a binary vote qualification matrix that are input into a second algorithm to predict the probability of crime observation in a certain area. More information about these models and results can be found here.

iWare-E is revolutionary in its ability to efficiently account for imperfect crime information and uncertainty while modeling complex data. It has been able to produce effective patrol routes in a way that has been less computationally expensive than other similar state-of-the-art models as well as improve accuracy and runtime. As a result, iWare-E has become the first adversary behavioral model for wildlife protection to be run in multiple locations, having been tested in two different protected areas within Uganda. To continue work in the future, the Teamcore group may look to transfer knowledge between areas with rich data sets (i.e. Uganda) and areas where data is much more scarce (i.e. Cambodia). This growth will help expand research and improve solutions across different domains.

Cassidy McDonnell is a May 2019 graduate of Vanderbilt University in Civil Engineering. She became interested in Computational Sustainability through Vanderbilt’s University Course on the Ethics of Artificial Intelligence, which included a module on Computational Sustainability. Cassidy can be reached at cassidy.a.mcdonnell@vanderbilt.edu. The opinions expressed herein are Cassidy’s and do not necessarily represent the opinions of Cornell University.

Pentagon Launches Machine-Learning Competition for Disaster Relief

This is a post by Emily Markert. See her bio at the bottom of this post.

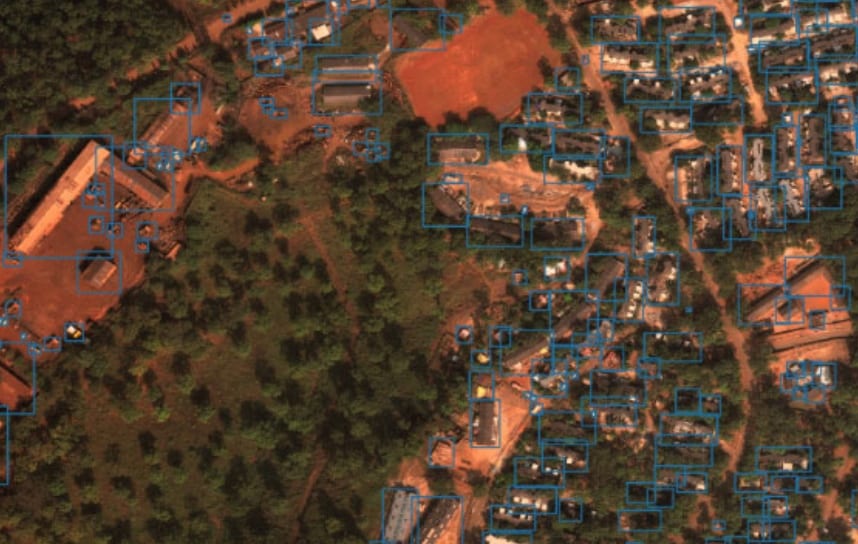
In the aftermath of Hurricane Irma, a team of analysts from the National-Geospatial Intelligence Agency (NGA) were tasked with manually annotating satellite images for signs of destruction, such as damaged buildings and roads, to facilitate the recovery and clean-up effort. The painstaking and time-consuming nature of this important task inspired the NGA to seek out a method of automating the annotation of satellite images, in hopes of improving the efficiency of damage reporting after future disasters.

An annotated high-resolution satellite image
Image credit: DIUx xView Dataset

To address this problem, the Pentagon has launched the xView Detection Challenge, which offers a $100,000 prize for the algorithm that can most accurately detect items relevant to disaster relief, such as damaged buildings and vehicles, from a set of high-resolution satellite images. The challenge is being managed by DIUx, an organization that facilitates collaboration between the Department of Defense and technology companies, in partnership with the NGA. Submissions to the challenge were due by July 22, 2018, and the winning algorithms will be announced on August 3.

In an article published by Wired describing this challenge, Stanford professor Stefano Ermon, who is a member of this research network, notes the potential contributions of the competition to machine-learning research, as well as humanitarian work.  Dr. Ermon’s own research involves using machine-learning to predict areas of poverty in Africa from satellite images.  Under the assumption that well-developed and non-impoverished areas are brightly lit at night, Dr. Ermon’s team has trained an algorithm to pick out areas that are well-lit or dark, as shown in nighttime satellite imagery, and then identify differences between those areas in daytime satellite imagery.  So far, identifying features such as roads and waterways have been used to successfully differentiate impoverished areas.  Dr. Ermon and his team hope that their algorithm can provide an inexpensive and scalable method of supplementing household survey data in the identification, and eventually remediation, of poverty.

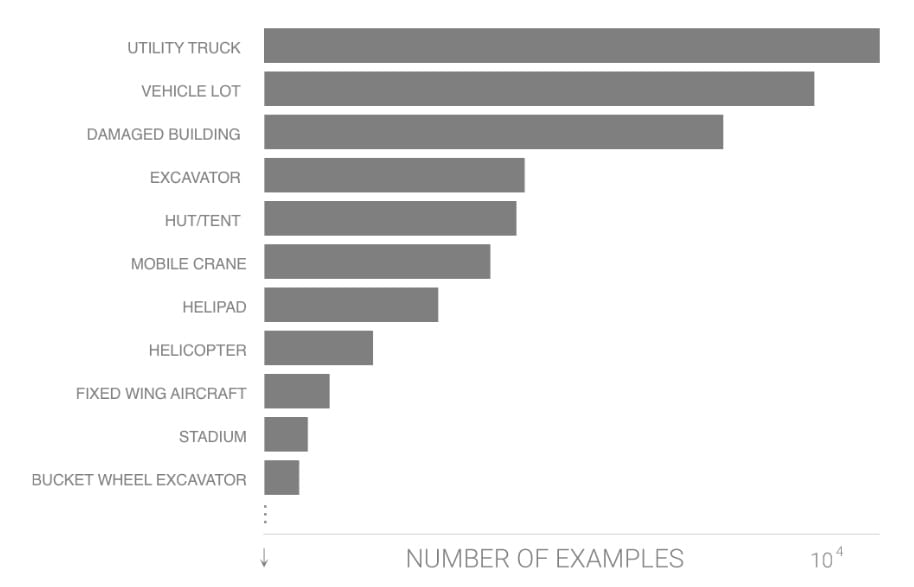
Chart showing numbers of examples of various objects in the xView Dataset
Image credit: DIUx xView Dataset

To learn more about Dr. Ermon’s work, visit his research team’s website, or watch a recording of his Computational Sustainability Virtual Seminar here.

Emily Markert is a Computer Science  undergraduate at Vanderbilt University supported by NSF Grant 1521672. The opinions expressed herein are Emily’s and not necessarily those of Cornell University or NSF. You can reach Emily at emily.markert@vanderbilt.edu.

Heightening Environmental Responsibility through Place Attachment

This is a post by Kamala Varma. See her bio at the bottom of this post.

Place attachment is defined as an emotionally-grounded person-to-place bond that causes a place to become a part of a person’s self-identity.  With respect to sustainability, place attachment can function as motivation for people to engage in pro-environmental behavior by using appeals to a person’s self-identity.  Someone is more likely to care about environmental issues surrounding a place that they feel connected to. This idea is similar to that mentioned in Selina Chen’s blog post, Making it Local.  She describes the power that “bringing the issues home” has to incentivize people to contribute to computational sustainability efforts.  Places that are local and close to home are likely those that people have a strong place attachment to. In this blog post, I will discuss strategies for building an attachment, and therefore a heightened sense of environmental responsibility, for places that are not necessarily close to home.

Knowledge acquisition

In order for someone to form a personal connection to a place, they need to be familiar with it.  This paper describes the degree of familiarity as something that can be increased by frequent encounters with a place, having a large body of knowledge about a place, or even by being able to recognize a place’s similarity to some familiar place in our memory.  One study expands on the idea of knowledge increasing place attachment.  Students were observed before, during, and after a geologic field trip, and the study found that learning performance was increased when students were taught a preparatory unit that allowed them to enter the field trip with prior knowledge of the subject.  The preparatory unit reduced the common field trip anxiety of entering new environments and not knowing what to expect, which inhibits learning performance. Therefore, having background knowledge of a place before experiencing it is beneficial in building place attachment because it increases a person’s capacity to become familiar with it through learning.

Agency

A similar study compared two distinct models of learning through geological field work.  A roadside module had students visiting up to two sites each day, which required more driving time and less extensive, but more collaborative assignments.  A situated module focused on a single area across the entire two weeks to conduct the field work in, while requiring more detailed assignments that were less collaborative.  The findings indicated that students formed a stronger attachment to the situated field area because of student autonomy (their ability to explore the space through their own agency) and the immersiveness of the landscape.  This supports the idea that forming place attachment is more effective when it happens on site, but further asserts that having agency in the exploration of a site increases effectiveness.

Involvement

Participants in an Andean Bear camera-trap study from the Computational Sustainability Network, are described to have been, on “…the last field day taking in the beauty and expanse of the study area and proudly pointing out the different areas where cameras would be placed, demonstrating not only their commitment to the project, but also to each other as a collective team with a common goal.”  In addition to forming an attachment to a place while being physically immersed in it, the fact that they were becoming actively involved in the landscape further increased participants’ commitment to the place. This suggests that not only can place attachment encourage involvement in positive environmental behaviors, but also that involvement in these behaviors can encourage place attachment!

RegionRadio:  Place attachment through storytelling

The new project that Emily Market introduced in her blog post, RegionRadio, highlights the ability that storytelling has to “…[immerse] people in the history of a place, increase the connection they feel to it, and therefore increase the likelihood that they would act to protect it.”  RegionRadio is using methods of building knowledge and of establishing a close physical proximity in order to form or strengthen place attachment.  It also introduces a interesting storytelling angle worth exploring, as the project will potentially start to incorporate stories written and read by users.  Similar to the Andean Bear study, writing and telling a story is a form of involvement that would strengthen place attachment. However, in this case the involvement is with a person’s memories, so the question arises of whether or not attachment can be strengthened without any new knowledge or experience, but by exercising past knowledge and experience alone.  With respect to the study of roadside vs. situated field work, having a RegionRadio user listen to a story told from someone else’s perception eliminates the agency of the learning and therefore decreases the potential for building an attachment.  However, one motivation for RegionRadio’s incorporation of user-authored stories is the assumption that they will be more compelling than most stories extracted from a Google search. Therefore, a possible new relationship to explore would be the effect that the interestingness of a story has on the formation of place attachment.

Agency in web exploration

Another relationship to further explore is the effect that the agency involved in web exploration around a place has on an individual’s attachment to the place.  This is applicable to RegionRadio’s process of automatically selecting stories from the Google search results, which is aimed to make the selection through filters of (among others) user preferences, but does not give the user direct authority in the choice.  Futurist Paul Saffo describes an individual’s ability to select information from a vast cyber-sea of media as a way to reinforce their pre-existing world views.  Information that conflicts with their perspectives is uncomfortable and therefore shut out, which Saffo claims to be detrimental to the growth of empathy.  Saffo’s perspective suggests that agency of web exploration can enhance place attachment because it is increasing a person’s knowledge and familiarity with select places.  However, the ability to form attachment to new places would be lessened because people will lose the capacity to understand and connect to unfamiliar places.

Kamala Varma is a Computer Science  undergraduate at Vanderbilt University supported by NSF Grant 1521672. The opinions expressed herein are Kamala’s and not necessarily those of Cornell University or NSF. You can reach Kamala at kamala.m.varma@vanderbilt.edu


The Global Phenomenon of Bike Sharing

This is a post by Abigail Roberts. See her bio at the bottom of this post.

This past spring, hundreds of bright yellow bicycles showed up on campus at Vanderbilt University. All you had to do was unlock the bike with your phone, ride it across campus, and lock it at your destination. Although I personally prefer walking over cycling, I became intrigued by the idea of bicycle sharing. Why is the idea spreading so quickly? Are these systems making a difference?

In a bicycle sharing system, a fleet of bicycles are made available in a city or neighborhood, and users can check out a bike, ride it across town, and leave it at their destination. By a recent estimate there are now over 14 million shared bicycles in cities around the world. With an explosion of companies in the last 10 years, bike sharing is quickly spreading with a goal of mitigating the environmental and economic impacts of traffic congestion in urban areas.

The 4 Generations of Bike Sharing

First Generation: Free Bikes

The first bicycle sharing program started in Amsterdam in 1965 as a grassroots solution to the pollution caused by cars. A group called Provo painted a bunch of bicycles white, and left them around the city to be used by anyone, for free. However, the anarchist political leanings of Provo caused the police to remove the bikes from the streets shortly after.

Second Generation: Coin Deposit

The next wave of bicycle sharing took off in the 1990s in Denmark. The rides were free, but users had to deposit a coin at a station in order to unlock a bicycle, and only got the coin back upon returning the bicycle. The coin system incentivized the return of bicycles, but since a user could not be identified, there were still issues of theft and vandalism.

Third Generation: Paid Access and Technology

Starting in 1998 in France, bike sharing systems began using technology at the docking stations to associate users with bicycles, and most systems began charging usage fees. As technology has improved, it has been integrated into bike sharing systems to allow GPS tracking of the bicycles and access via smartphone. Since 1998, these systems have had the data to tackle the problem of “rebalancing,” which is optimizing the distribution of bicycles across docking stations so that users will not find themselves in an area without any available bicycles.

Fourth Generation: Dockless and Electric Systems

In the last few years, the industry has begun to evolve again with the introduction of dockless bike systems that aren’t tied to specific docking stations, as well as electric bikes that make travel more efficient and accessible to more users. These trends introduce new problems of optimizing the distribution of bicycles without the anchors of specific stations, and in the case of electric bikes, providing places for the bicycles to be recharged becomes necessary.

Research and Bike Sharing

Researchers from Cornell University who participate in the Computational Sustainability Network have been working on ways to optimize operations for one particular bike sharing company, Citi Bike, which operates in New York City. In 2016, Nanjing Jian, Daniel Freund, Holly M. Wiberg, and Shane G. Henderson tackled the problem of optimizing allocation of bicycles at docks across the city. They were able to use heuristic methods to demonstrate a simulation-optimization approach that is computationally feasible for real-life data. In 2018, Hangil Chung, Daniel Freund, and David B. Shmoys analyzed various incentive programs that could be used to encourage users to help with balancing the distribution of bicycles throughout the city; Citi Bike ended up using one of the incentive programs in practice.

Research has also looked at the benefits of increased access to cycling. A 2014 study in London found overall health benefits from bike sharing, though the benefits were greater for men and for older users. This recent paper found a noticeable decrease in carbon dioxide emissions in Shanghai, China due to bicycle sharing. In Barcelona in 2011, this study found reduced carbon dioxide emissions due to cycling, as well as finding that the health benefits of increased physical activity outweigh any potential negatives of traffic fatalities or air pollution inhalation while cycling.

In the rapidly growing industry of bicycle sharing, there will continue to be opportunities for research with applications to these systems, whether examining the benefits and results of these programs, or using computational methods to solve the logistical challenges these systems face. As bicycle systems continue to evolve, research can be extended to emerging Fourth Generation systems. For example, consider how the Cornell work on the rebalancing problem is impacted by dockless systems: instead of centering analysis around fixed docking stations, the analysis might focus on areas with clusters of pick-up and drop-off activity, as well as taking into account situations where a bike is left isolated somewhere for an extended time. Dockless systems also introduce new possibilities for incentive programs that exploit the flexible nature of these new systems. Though there are still many questions to answer with regards to bicycle sharing, the research consensus seems clear: bicycle sharing systems are a benefit to both personal health and local sustainability efforts.

Abigail Roberts is a Computer Science  undergraduate at Vanderbilt University supported by NSF Grant 1521672. The opinions expressed herein are Abbey’s and not necessarily those of Cornell University. or NSF You can reach Abbey at abigail.k.roberts@vanderbilt.edu.

Plastic Debris: a Carrier of Coral Disease

This is a post by Emily Markert. See her bio at the bottom of this post.

A new study led by researchers from Cornell University, including Drew Harvell of this research network, found that plastic debris in the ocean increases the risk for disease in coral.  Plastic debris has been shown to negatively impact coral in a number of ways; plastic items, specifically those made of polypropylene, provide “ ‘ideal vessels’ ” for bacteria associated with white syndromes, a “ ‘globally devastating group of coral diseases’ ”, as Joleah Lamb explains in the Cornell Chronicle.  Plastic pieces can also scratch the surface of coral, or block light from reaching it, which weakens the coral and makes it even more susceptible to disease.  The research team behind this study assessed the relationship between plastic debris and disease in coral by surveying 159 coral reefs throughout the Asia-Pacific region, and have published their findings in Science Magazine.

Plastic debris caught on a coral reef

Image Credit:  Kathryn Berry/James Cook University  (found in the Cornell Chronicle)

Of the coral reefs examined, coral in contact with plastic debris was found to be 20 times more likely to be affected by disease.  This statistic is especially concerning, since diseases such as white syndromes cause permanent coral tissue loss and can spread throughout a reef.  Additionally, the already high volume of plastic trash entering the ocean each year is only expected to increase; researchers predict (using a generalized linear mixed model) that by 2025, 15.7 billion pieces of plastic will be caught on coral reefs in the Asia-Pacific region alone.  This estimation was based on a previous prediction of the amount of plastic trash entering the ocean, which used a model that considered population density and economic status of coastal regions.  Since coral reefs with complex structures, which provide the best habitats for fish and microorganisms, are especially likely to snag floating plastic, it is expected that the most valuable coral reefs will be especially prone to the growing threat of disease.

Estimated contributions of mismanaged plastic waste to debris levels on coral reefs, by country

Image credit:  Lamb et al., published in Science Magazine

The destruction of corals has many devastating consequences.  Coral reefs support extremely biodiverse ecosystems, and the loss of the rich habitat they provide can reduce the productivity of fisheries by two thirds.  Corals are also estimated to provide a yearly value of $375 billion “through fisheries, tourism, and coastal protection”, and are crucial to the wellbeing and livelihood of 275 million people worldwide.

The researchers behind this study hope that their findings, while distressing, will serve as motivation to reduce the amount of plastic debris entering the ocean in the future.  In an article by the Cornell Chronicle, Drew Harvell explains that “ ‘while we can’t stop the huge impact of global warming on coral health in the short term, this new work should drive policy toward reducing plastic pollution.’ ”

For more information on the effect of plastic pollution on coral reefs, see the original article in Science magazine, or a publication in the Cornell Chronicle.

Emily Markert is a Computer Science  undergraduate at Vanderbilt University supported by NSF Grant 1521672. The opinions expressed herein are Emily’s and not necessarily those of Cornell University or NSF. You can reach Emily at emily.markert@vanderbilt.edu.

A Review of Wildbook: Software to Support the Environment

This is a guest post by Carmen Camp. See Carmen’s bio at the bottom of this post

Wildbook is an open source software platform devoted to tracking animals in the wild and decreasing the chances of extinction in different species. The software itself, WildMe, is publicly available on GitHub to encourage people to join the movement in protecting wildlife. Much of the success of the program relies on citizen science and interaction, and the system itself utilizes artificial intelligence to identify animals and other environmental features from photographs. A unique advantage of using photos for identification purposes is that when an individual animal is encountered in the wild, today’s digital cameras are able to capture a large number of high quality photographs before the encounter is over. These photos may then be used to further improve animal identification by using machine learning software that is available through Wildbook.

Wildbook processes photos from research teams, social media, and citizens alike. Wildbook uses deep convolutional neural networks to analyze a photograph, and identify animals, plants, and other objects contained within the scene. The system’s pattern matching algorithms are also capable of identifying unique individuals that are known to research teams. This gives scientists important opportunities to track individuals, as well as populations, and social interactions of the animals.

Early Work with Whale Sharks

The purpose of Wildbook is to be an open-source platform that enables different research teams to perform photo identification with limited manual labor. Since its beginnings, Wildbook has been used by many projects, one of the first of which was a 2005 project to study whale sharks. The photo identification software was based on software to identify constellations (Arzoumanian et al., 2005). Once adapted, the software enabled researchers to identify whale sharks from their size and shape, as well as their spot patterns. Spot coordinates are represented in XML and either match known individuals, or are used to identify previously unrecorded individuals.

A later study in 2008 also used a whale shark database along with the lab’s mark-recapture methods to better understand the survival rates of whale sharks in Western Australia (Holmberg et al., 2008). The 2005 and 2008 studies, and others, have led to a “Wildbook for Whale Sharks” organization that is dedicated primarily to keeping track of whale sharks around the world. The organization’s website has a featured link that allows users to “Report your sightings,” which requests input about the user, the sighting, its date and location, and whatever footage or photos the user captured of the whale sharks.

Improvements in the Wildbook for Whale Sharks software has spread coverage of whale sharks from Western Australian populations, to the Philippines, to the Western Atlantic Ocean. While some studies focus on geographic areas and the distribution of the animals (Araujo et al., 2016), others track specific animals (Norman and Morgan, 2016). Still other projects track social groups and seasonal migrations of different populations, like the 2013 study on sharks in the Gulf of Mexico and the Caribbean Sea (Hueter et al., 2013).

Extending Wildbook to other Species

Not only can an organization for an individual species like whale sharks use Widbook, but citizens and scientists alike can participate in the research by providing photographic evidence of many types of animals. Manta Matcher is another example of programs that have been able to form because of the capabilities offered by Wildbook. Its website has a nearly identical setup to Wildbook for Whale Sharks, and it provides easy access to a page through which users can submit data and photographs they collected. Flukebook is yet another option for photo identification that is, as its name might suggest, an identifying software for the flukes of whales. Each of these programs that are directly related to Wildbook offer resources that in turn are used by many scientific organizations. For example, the Dominica Sperm Whale Project uses Flukebook to keep track of individuals in the island’s surrounding waters. Shane Gero, a scientist from the project, is quoted on WildMe’s website, saying, “PhotoID as a tool for conservation and research finds power in numbers and international, inter-institutional collaboration,” indicating that a globally collaborative platform like Wildbook is exactly what the scientific world needs to get answers and solve problems.

Some programs use Wildbook to find individual known animals, rather than categorizing creatures as one species or another. In 2013, an algorithm was introduced called HotSpotter, which used pattern matching methods to identify unique sections on photographed animals. Thus, HotSpotter became a versatile option for identifying multiple types of animals, as well as individuals within the same species. HotSpotter focuses on identifying key points on animals in the frame of the photograph, and it then uses a nearest-neighbor search to compare the new photo with pre-existing records in the database of individual animals. To train and test the system, it was run on photos from scientists, assistants, ecotourists, and ordinary citizens. The software has been successfully used on many creatures, including two types of zebras, giraffes, leopards, and lionfish (Crall et al., 2013).

Citizen Scientists and Wildbook

Every example of Wildbook usage for external research highlights the importance of citizen interactions that make the research possible. Machine learning schemes and artificial intelligence typically require large amounts of data with which to be trained, and in order to test the algorithms, completely fresh, non-repeated data files must be used. This means that in order for an algorithm to be effective and accurate, it must have a huge source of data files, which in this case are photographs. Thus, citizens’ and the public’s interactions with projects like Wildbook are essential to success. This necessity for external input is evident in many related pieces of research, such as a 2017 case study on Twitter. This study discusses the crucial role that everyday members of the public play in data collection. In this study, the researchers wanted to train a machine learning algorithm to identify emotions in tweets on Twitter. The people on the research team, however, could not manually provide enough examples and training data to have a fully functioning algorithm. It simply would take far too long to be worthwhile. Using citizen scientists, however, the team was able to gather enough data to get their algorithm running accurately in a reasonable amount of time (Sastry et al., 2017).

Not only is advancing technology providing more opportunities for the public to get involved with research, but it is also offering new and more accessible ways of participating in different projects. Take, for example, the Humane Society, which asks citizens to submit information about roadkill they come across online. The National Audubon Society also has a program for volunteers to count and monitor birds for an annual census. Programs such as these, as well as Wildbook spinoffs, allow citizen scientists to submit vital information through the internet or applications. Evolving technology has placed the ability to submit such data directly in our hands through mobile phones and other devices, and the internet offers places to submit data, as well as aids to citizens in finding causes and projects with which they can help.

WildMe’s website divides citizen scientists into four distinct groups that are categorized by the role the citizens play in research. The first group are denoted as “scientists.” These citizens are incredibly engaged in the research, and they focus their efforts on analyzing data and determining its meaning. Second are the “evangelists,” who are devoted to outreach and explaining the research project to the public. They play an important role in motivating more people to join them in the effort, as well as building communities that support the research. The next role is “the technologist,” which further emphasizes the significance of technological advancements. These people make sure that the IT side of the project allows it to be as efficient and interactive as possible. Finally, “the volunteer” educates members of the public so that they are capable of collecting data, monitoring inputs, or analyzing information, as it may relate to the research.

Wildbook in the Global Community

Those in charge of Wildbook also understand the power of globalization and how the world is connected through the internet. With an active Twitter account, the organization is able to advertise itself through new pieces of research that use the software. The Wildbook Facebook page is also active. It provides similar updates to Twitter, as well as chances for visitors to donate to the cause, attend related events, and participate in virtual reality activities to learn more about the animals. For example, The “Great Grevy’s Rally” is currently publicized on the Facebook page, and it invites people to go to Kenya in January to help complete a census on the Grevy’s zebras in the area. It welcomes any and all aspiring citizen scientists to join the charge in driving around a designated area to photograph and document and zebras seen in the area. The data collected will then be put into the Grevy’s zebra Wildbook database. The Facebook link on the event page redirects one to a page describing the Grevy’s zebra mission, and clearly offering tips on how to become a citizen scientist and help the cause. By marketing these events in places that supporters are likely to see them, Wildbook gains both support and renown via the internet.

Wildbook provides an incredible opportunity to globalize scientific and ecological missions like was never before possible. Individuals of any profession from around the world can participate in the global mission to save and preserve the planet on which we live. The software provides an interface between science and the public that is easily accessible, especially for individual species that have their own associated organizations and easily accessible databases and websites. From whale sharks, to giraffes, to leopards, to lionfish, Wildbook has introduced endless options for collaboration. More than simply using user-generated photographs, Wildbook offers people the option to get involved and have a part in science, which is a crucial piece of gathering a force together that can have a positive impact on our changing world and dangerously shifting animal populations.

Carmen Camp will graduate in spring 2018 with a degree in Computer Science and Corporate Strategy. She is passionate about marine science and hopes that her future will include plenty  of opportunities to help protect the ocean. She may be contacted at carmen.camp@vanderbilt.edu.

References

Araujo, G., Snow, S., So, C. L., Labaja, J., Murray, R., Colucci, A., and Ponzo, A. (2016) Population structure, residency patterns and movements of whale sharks in Southern Leyte, Philippines: results from dedicated photo-ID and citizen science. Aquatic Conserv: Mar. Freshw. Ecosyst., doi: 10.1002/aqc.2636.

Arzoumanian Z, Holmberg J & Norman B (2005) An astronomical pattern-matching algorithm for computer-aided identification of whale sharks Rhincodon typus . Journal of Applied Ecology 42, 999-1011.

Hueter RE, Tyminski JP, de la Parra R (2013) Horizontal Movements, Migration Patterns, and Population Structure of Whale Sharks in the Gulf of Mexico and Northwestern Caribbean Sea. PLoS ONE 8(8): e71883. doi:10.1371/journal.pone.0071883

Holmberg J, Norman B & Arzoumanian Z (2008) Robust, comparable population metrics through collaborative photo-monitoring of whale sharks Rhincodon typus. Ecological Applications 18(1): 222-223.

J. P. Crall, C. V. Stewart, T. Y. Berger-Wolf, D. I. Rubenstein and S. R. Sundaresan, “HotSpotter — Patterned species instance recognition,” 2013 IEEE Workshop on Applications of Computer Vision (WACV 2013), pp. 230-237.

Norman B. and Morgan D. (2016) The return of “Stumpy” the whale shark: two decades and counting. Front Ecol Environ 2016; 14(8):449–450, doi:10.1002/fee.1418

Sastry, N., et al.: “Bridging big data and qualitative methods in the social sciences: A case study of Twitter responses to high profile deaths by suicide,” Online Social Networks and Media (2017)

http://www.ecology.com/2014/11/19/importance-citizen-scientists/

Wildbook: http://www.wildbook.org/doku.php?id=start

RegionRadio and Related Works

This is a post by Emily Markert. See her bio at the bottom of this post.

Many of us have experienced car rides, both short and long, filled with small-talk, music played from a radio, or even podcasts. Although these media seem to do well enough at keeping us entertained, they often contribute little to any higher purpose. The vast amount of time people spend in transit has great potential to provide a meaningful experience, yet typically goes unutilized. Thus, we introduce RegionRadio, a spatially-aware storytelling tool aimed at supporting sustainability efforts through place-based education. The theory behind place-based education argues that immersing people in the history of a place can increase the connection they feel to it, and therefore increase the likelihood that they would act to protect it. In this way, RegionRadio exhibits place-based education by presenting stories to a user as they travel along a route; these stories are mandated to be relevant to the user’s current geospatial location, to contain topics related to environmental concepts, and eventually, to be customized to specific users’ preferences and histories. These stories are analyzed and filtered based on their topic, perceived interestingness, and continuity of the ‘playlist’ presented to the user throughout their journey. Use of RegionRadio is intended to be as simple as turning on the radio, but aims to develop ordinary citizens as environmental advocates by heightening appreciation of their surroundings through the telling of stories.

Although this project is unique in its sourcing and presentation of environmentally-focused place-based education,  we take inspiration from other work in spatially-based education, to include SCRABS and DETOUR.

The SCRABS system was designed by a group of researchers from the Cultural Heritage Information Systems national project, and is intended to increase cultural appreciation by presenting users with personalized, context-based information as they explore historic sites. The system has not yet been fully developed, but presents an ambitious design that can be further reviewed in this publication. This context-dependent recommendation of information aimed at increasing cultural appreciation is highly relevant to our own task, but applied to a different domain.

We consider another tool that is fully-developed, and has potential to convey place-based education. Detour is a growing platform offering the creation and taking of a novel type of audio tour. Taken on the user’s own smartphone, Detours can be taken in both indoor and outdoor spaces, and progress as the user moves through space, triggering narrations and other media along the way. While most existing tours published with Detour focus on urban areas, there is great potential in creating Detours for more natural settings. Allowing users to download tours that might lead them on a hike, through a National Park, or on a scenic drive would make place-based education easily accessible for Detour’s thousands of users.

To keep up with RegionRadio, stay tuned to this blog.

Region Radio a collaboration between the CompSustNet  lab at Vanderbilt University and the Space, Learnng, and Mobility lab at Vanderbilt University.  Research and development of Region Radio is supported by NSF Award #1521672 “Collaborative Research: CompSustNet: Expanding the Horizons of Computational Sustainability” and NSF Award #1623690 “EXP: Bridging Learning in Urban Extended Spaces (BLUES) 2.0

Emily Markert is a Computer Science undergraduate at Vanderbilt University. The opinions expressed herein are Emily’s and not necessarily those of Cornell University. You can reach Emily at emily.markert@vanderbilt.edu.