In this article, we feature the eDNA training experience of two researchers from University Malaysia Terengganu (UMT), Ain and Ruby, who were familiar with molecular biology techniques but wanted to delve into the nuances of eDNA sampling.
We chose the invasive Rusty crayfish (Faxonius rusticus) as the target species and the nearby streams in the Cayuga Lake watershed as sampling sites. An invasive species meant that it was abundant and probably found almost everywhere. There is no denying the convenience and low cost of having nearby sampling sites.
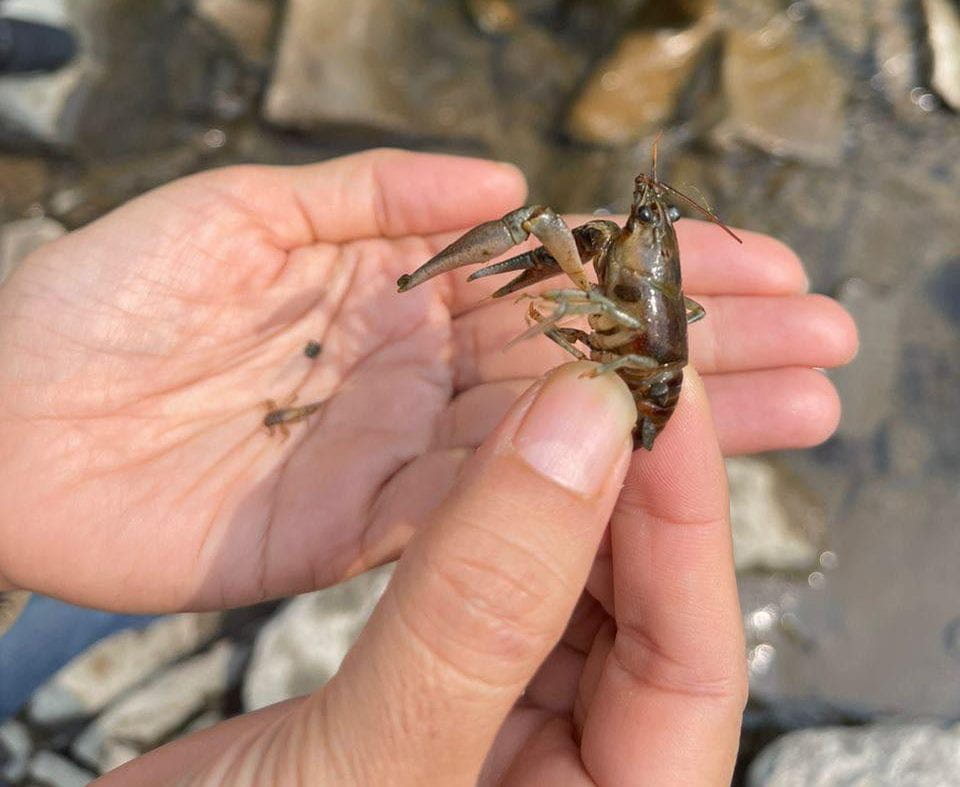
This lobster-like crustacean can grow up to 6 inches and is an opportunistic omnivore that can consume large amounts of vegetation, eating 2 to 3 times as much per day as native crayfish. Its voracious appetite dramatically changes the habitat by reducing plant cover which in turn reduces the amount of shelter for fish and other invertebrates as well as contributes to sediment erosion. It can be easily found hiding under rocks, logs, or trees.
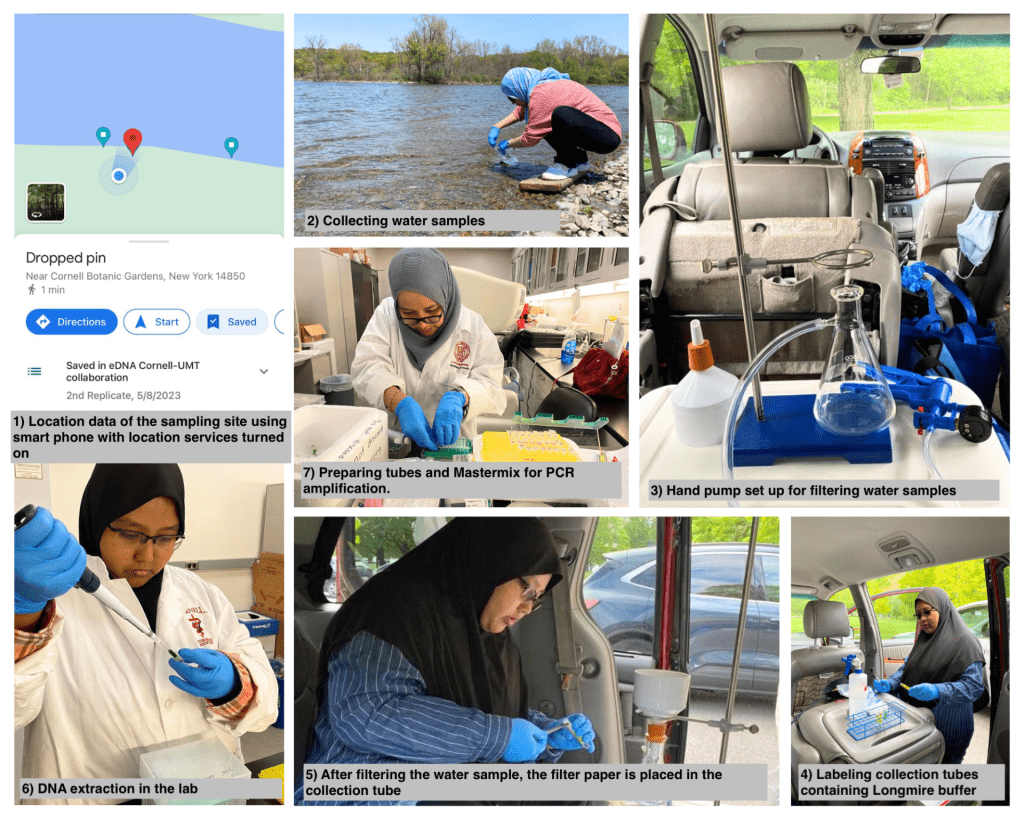
The starting point of our single-species eDNA protocol was to record the date, time, weather, and characteristics of the sampling site using a standardized form on Google Sheets, accessed using a smartphone. The smartphone was convenient for recording location data, pictures, and videos of the sampling site. We took precautions to avoid DNA contamination by wearing gloves, changing them frequently, and using 10% bleach to decontaminate the hand pump and forceps used to handle the filter paper.
The eDNA literature indicated that sample volume affected the amount of DNA collected. This makes sense because the larger the volume of the water sample, the higher the chance of detecting an organism’s DNA. We compared DNA concentrations collected from 300 mL, 500 mL, 1ooo mL, and 2000 mL sample volumes.
We followed the FishTracker water collection protocol with some modifications for testing different sample volumes. At Fall Creek, we collected 3 replicates of each sample volume using Ziploc bags (assumed to have no DNA contamination since they were new), with each replicate taken 50 feet apart. Per the protocol, each replicate needed a control, which could be a bottle of tap water that was filtered before we filtered the stream water sample. Doing the math, that was 12 stream water samples and 12 control water samples to be filtered with a HAND PUMP! Fortunately, the close proximity between Fall Creek and the lab meant that we were able to filter samples in this round of validation with motorized pumps.
Participants of the Fishtracker protocol would have a hand pump for each replicate. Since we had only one hand pump, we decontaminated it with 10% bleach in between replicates, crucial for preventing DNA contamination of the samples and ensuring the validity of the results.
Using low-tech and low-cost sampling equipment like Ziploc bags and hand pumps makes eDNA more accessible to citizen scientists. For example, the FishTracker program has successfully engaged students throughout the Cayuga Lake Basin to learn more about their watershed and if their home streams have rare or invasive fish species.
Nanodrop readings confirm that Rusty crayfish DNA concentrations from the 1000 mL samples were higher than 300 mL samples. Interestingly, DNA concentrations extracted from 2000 mL samples were not significantly higher than the DNA concentrations from the 1000 mL samples. This helped us decide that 1000 mL was the optimal sample volume for our other field sites, significantly reducing the number of samples for filtration at each site. We would only need 3 water samples and 3 control water samples per site.
Ruby filters water samples using a motorized pump which can process many samples quickly. Filtering equipment is decontaminated with 10% bleach in between sample replicates. Video by Lee Yoke Lee
Whenever possible, we endeavored to filter water samples on-site to avoid having to transport heavy bags of water samples and to reduce the risk of eDNA degradation and cross-contamination across sample sites since Ziploc bags do leak. Once filtration was done, the filter paper (Whatman cellulose nitrate, pore size 0.45 um) was placed in a vial containing Longmire buffer and placed in a cooler with ice packs. The interval between sample collection and filtration ranged from 2 to 6 hours. The vials were stored in the refrigerator if we extracted the DNA the following day. The vials were stored in a -20 degrees Celsius freezer when DNA extraction did not happen within the week.
We also tried out passive eDNA collection (leaving filter paper suspended in netting in Cayuga Lake for 24 hours and 48 hours). Passive eDNA collection is an alternative to active filtration, which as shown above, can be a logistical nightmare in itself. Although we did not get any significant difference in DNA concentrations when compared to active filtration sites, passive eDNA collection is worth revisiting, especially in the marine environment. It is not easy to filter water samples on a rocking boat without getting seasick and there are a large number of samples to be processed. Offshore island sampling sites meant that electricity may not be easily available to power motorized pumps for filtration. The one drawback is that you would need to return to the site to collect the filter paper, which means that you would need a marker buoy for the deployed filter (hopefully not disturbed or lost during the collection process) and hopefully good weather. The key point is that you want to collect eDNA samples in an efficient and low-cost way while ensuring that DNA degradation is minimal.
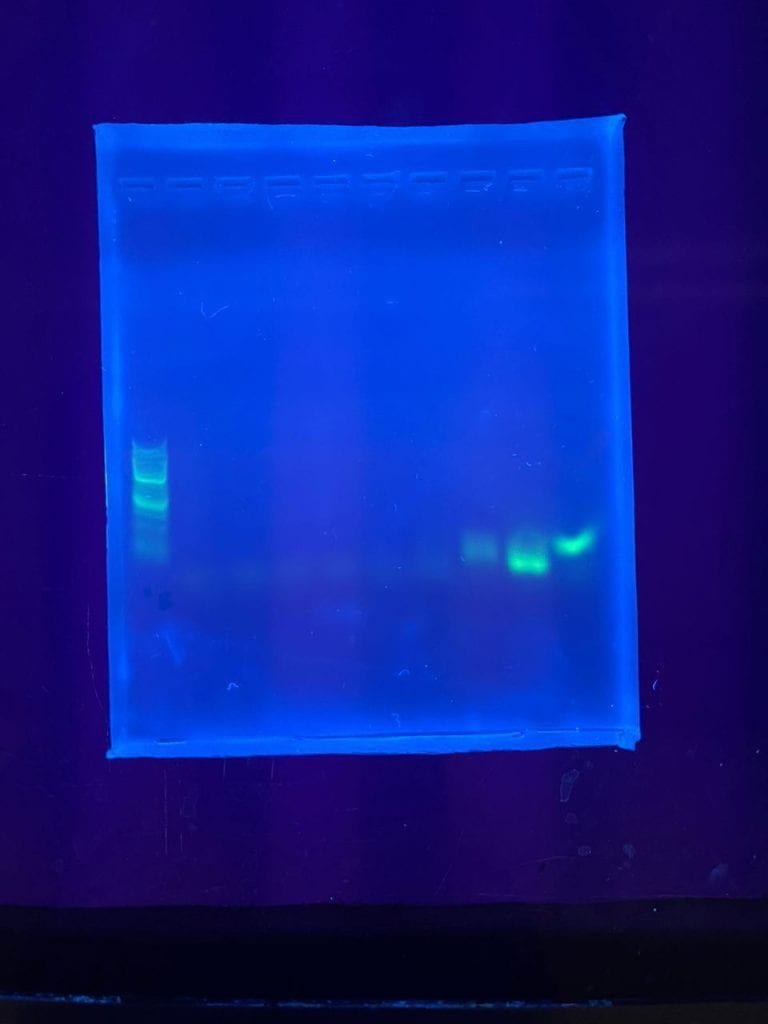
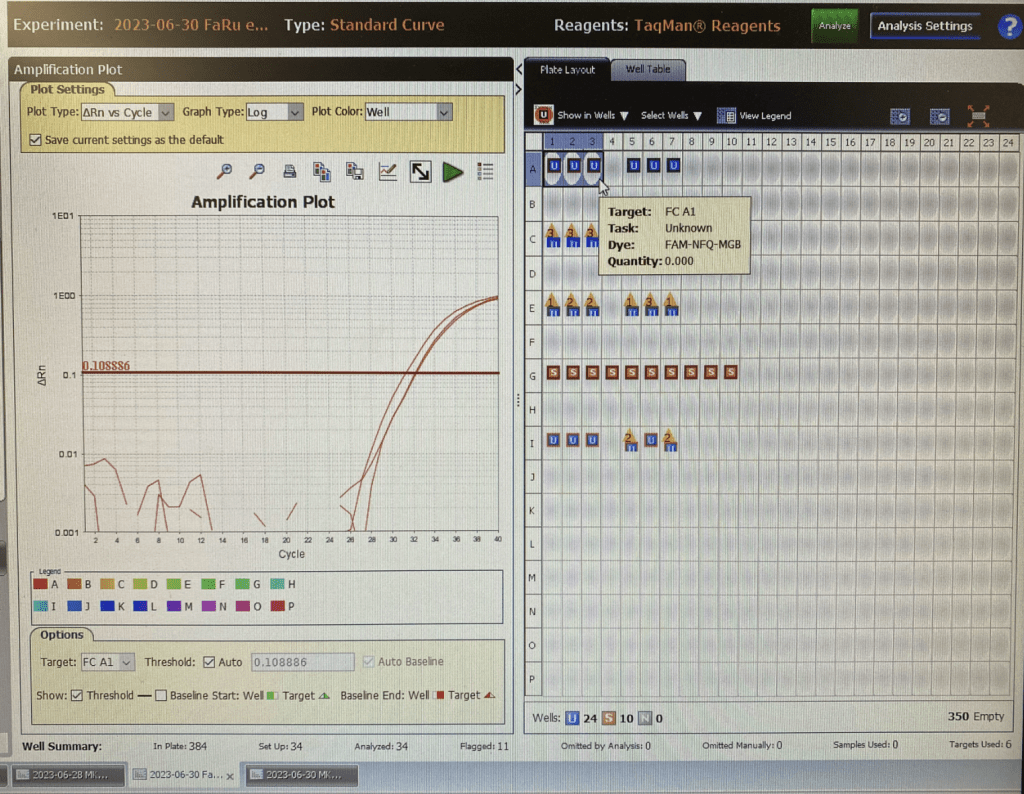
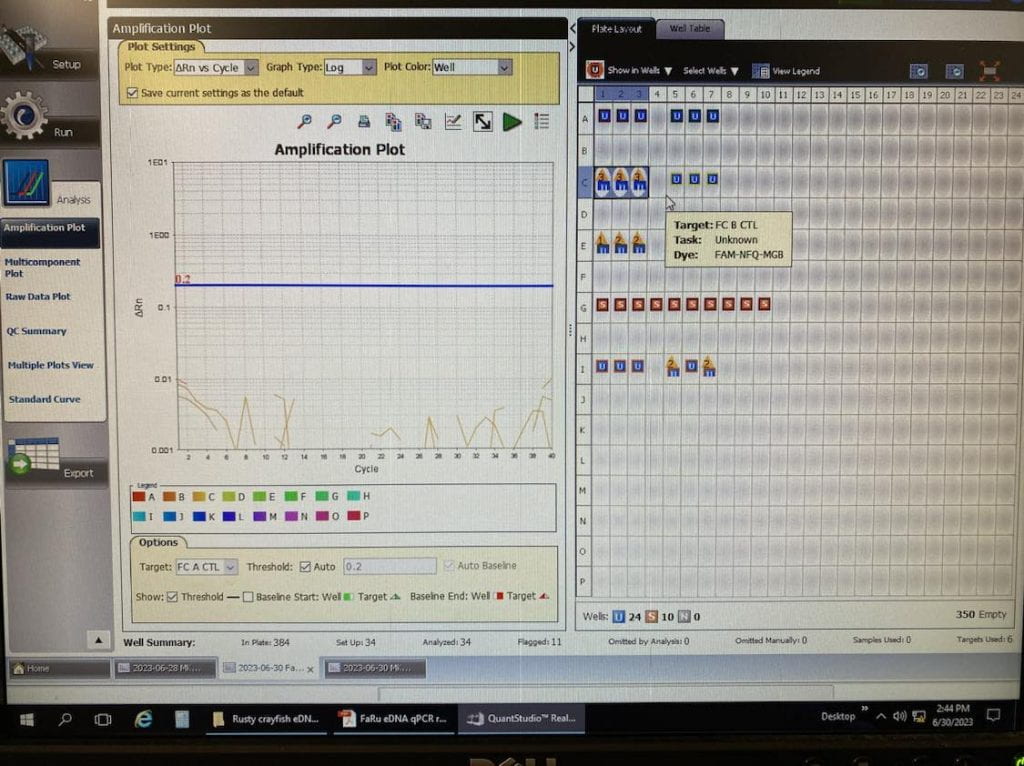
We added two additional steps to the Fishtracker protocol: the amplification step in the polymerase chain reaction (PCR) of the extracted eDNA and the verification of the PCR product using gel electrophoresis. These additional steps increased our confidence that we have relatively pure eDNA for the qPCR step, which uses expensive reagents such as the Environmental Taqman mastermix and probes. If the extracted DNA had phenol contamination or other issues, we would be able to troubleshoot and address these issues first without wasting expensive reagents. Once satisfied, we proceeded with qPCR.